
SNMP Data provides detailed network traffic stats in both graph and table formats. Make sure the SNMP v2c or v3 details are provided for the Devices of interest under the Inventory section. “Narrow By” Locations, Devices, or Interfaces and “Group By” Agent Address and/or Interface SNMP Index to focus or broaden attention to the desired aspects of network traffic.
SNMP Data Explorer can be accessed either from the Main Menu or by clicking on any widget’s header on dashboards containing the “SNMP” tag. Any grouping and narrowing by criteria previously set up in widgets will auto-populate in SNMP Data Explorer.
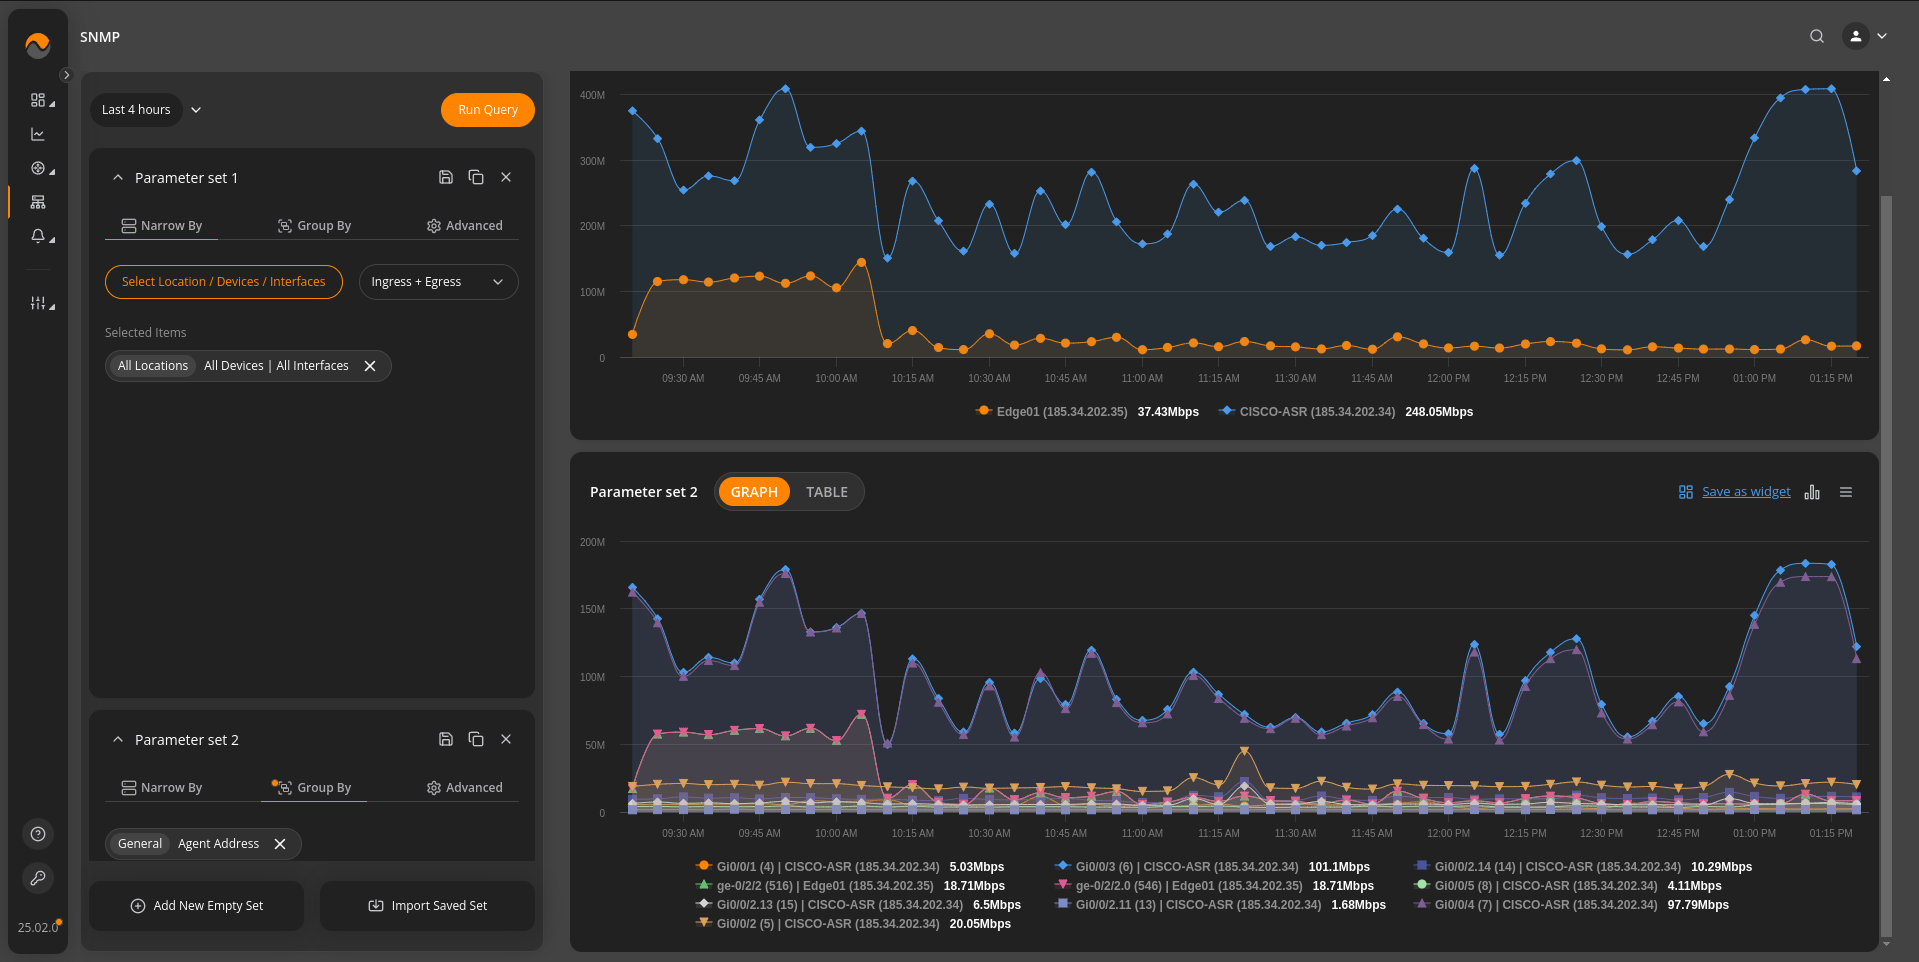
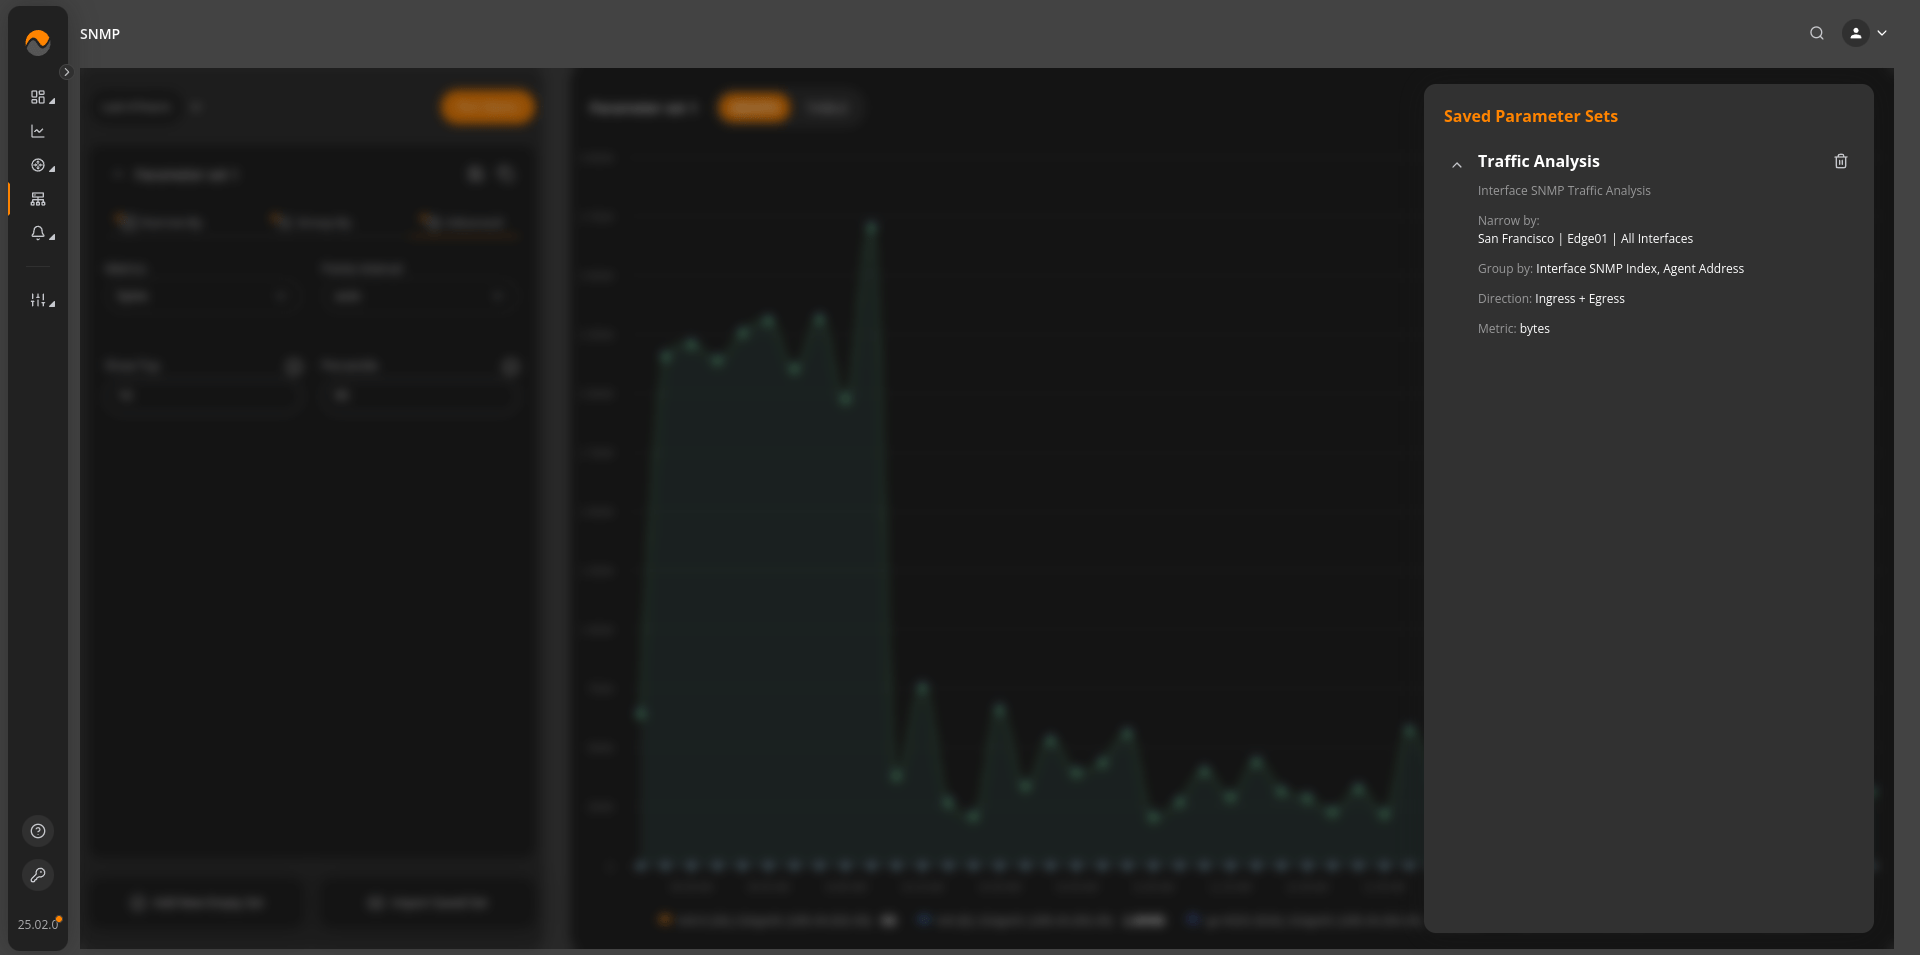
SNMP Explorer supports the addition and execution of multiple parameter sets simultaneously. This allows users to input several SNMP parameters and run them concurrently, streamlining the monitoring process and providing a more comprehensive view of network performance. Parameter sets can be renamed / saved and imported later on when required.
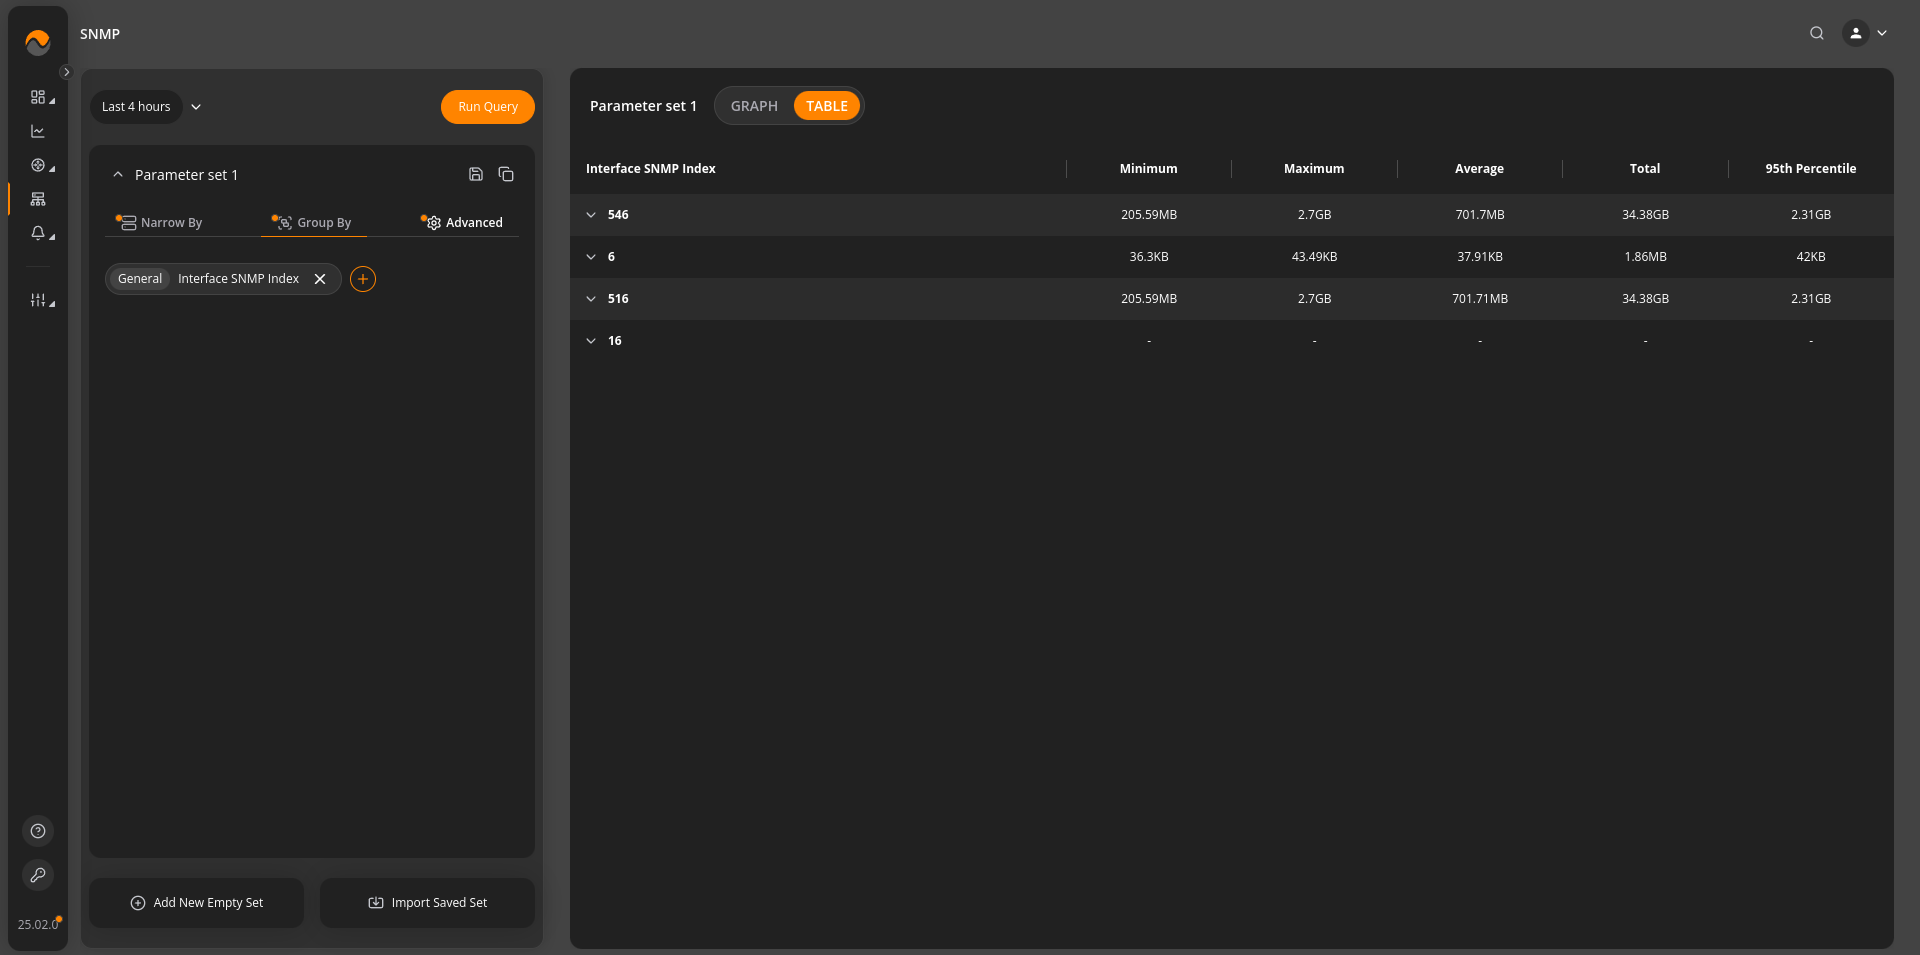
The table view can facilitate quicker decision-making based on SNMP metrics.
For traffic direction we can choose options:
- Ingress + Egress
- Ingress
- Egress
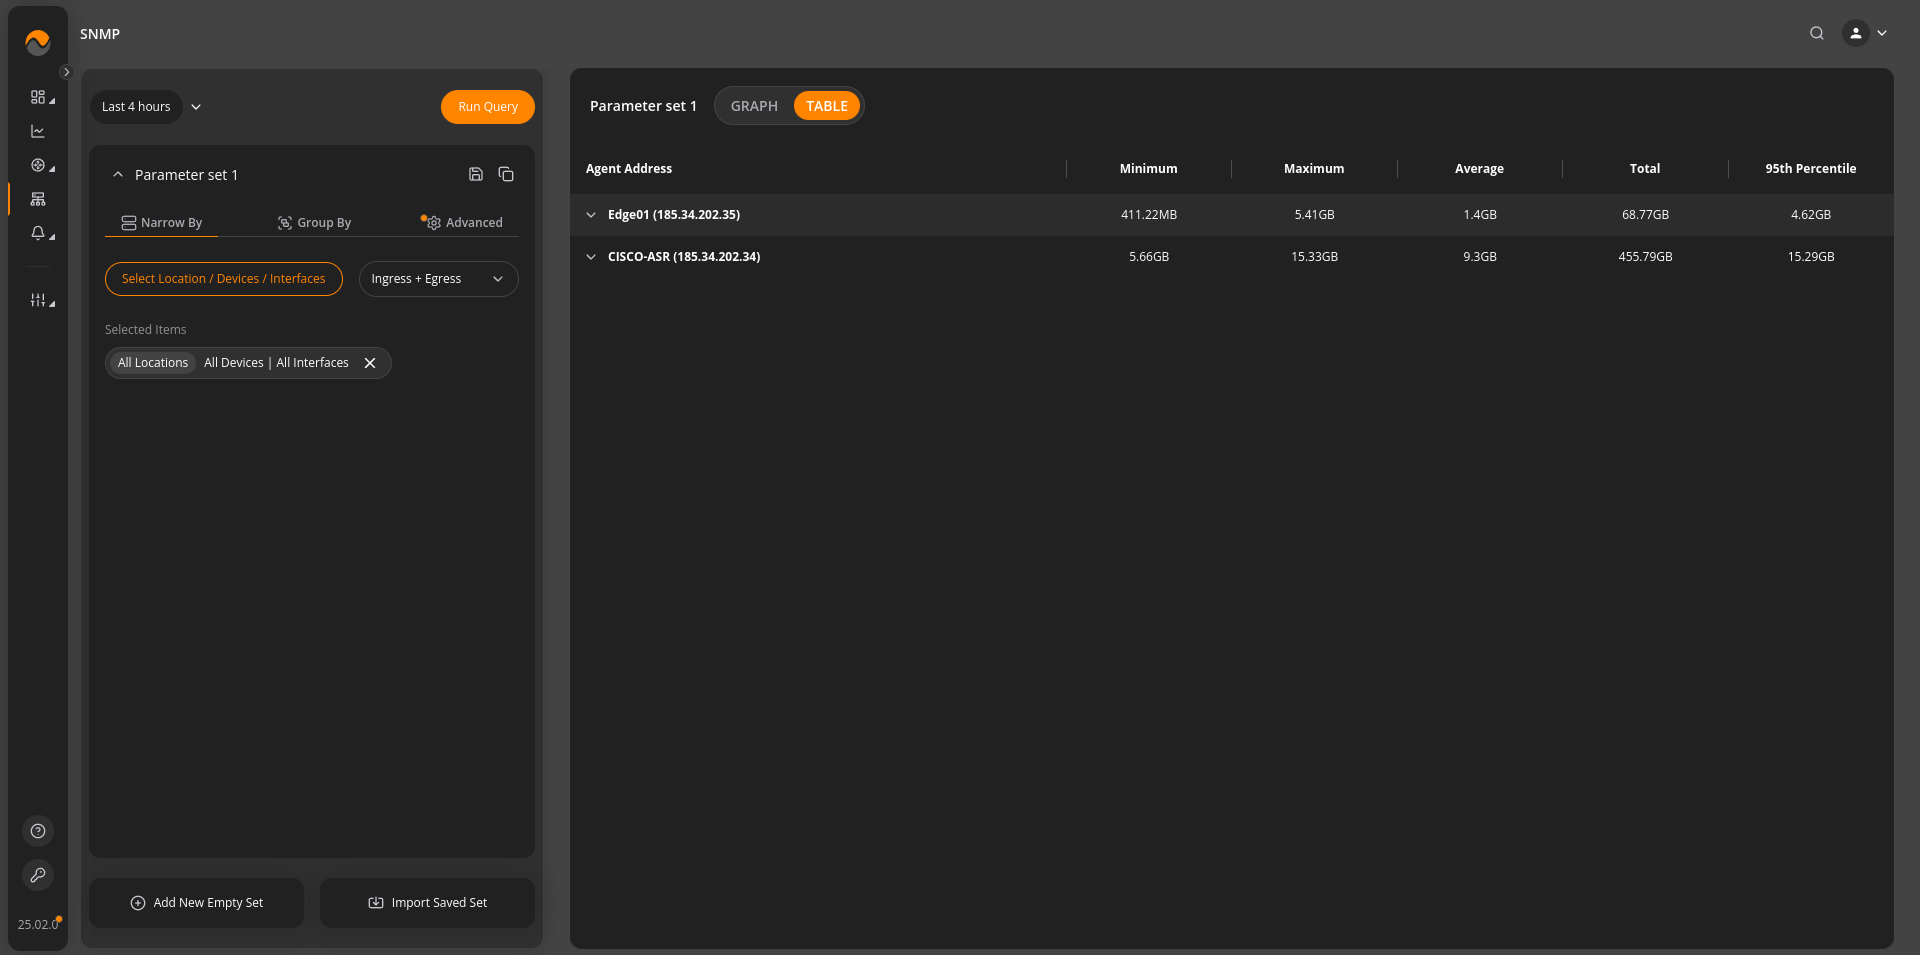
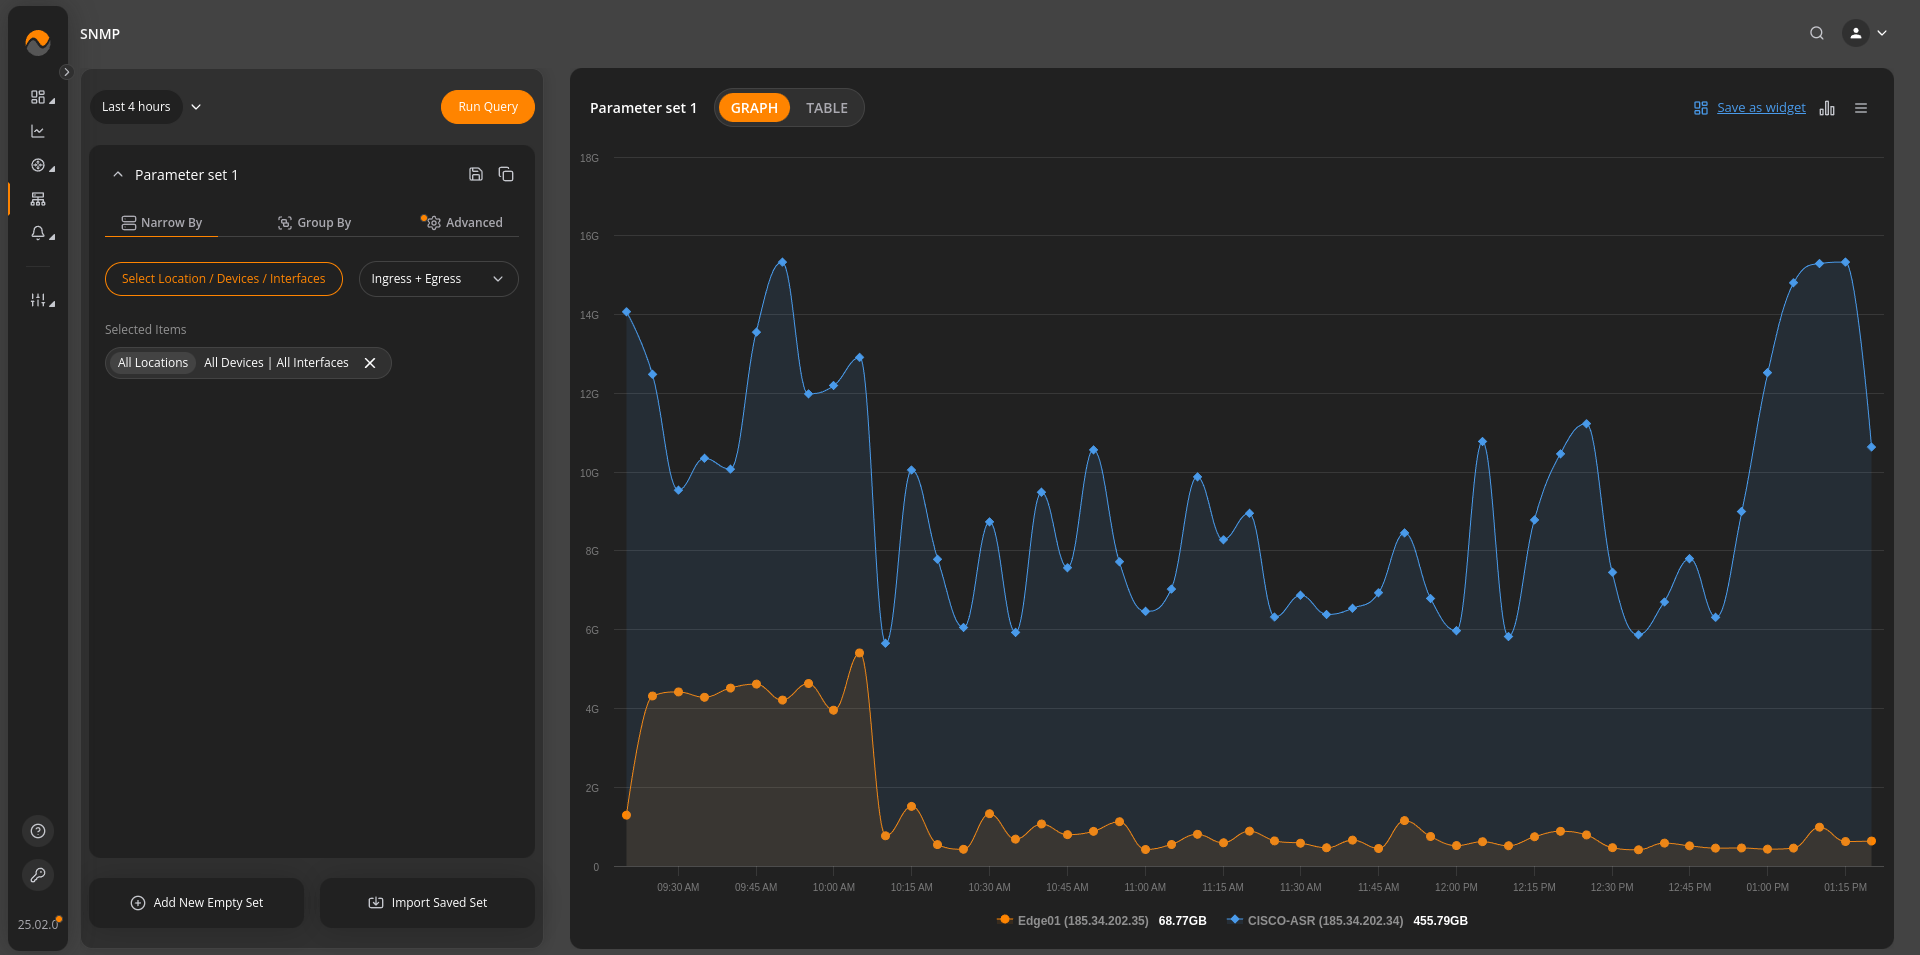
We can group agent addresses and interfaces, allowing us to visualize the data in both table and graph formats. For each device, in this case Edge01 and CISCO-ASR, it is displayed the minimum, maximum, average, total, and percentile data.
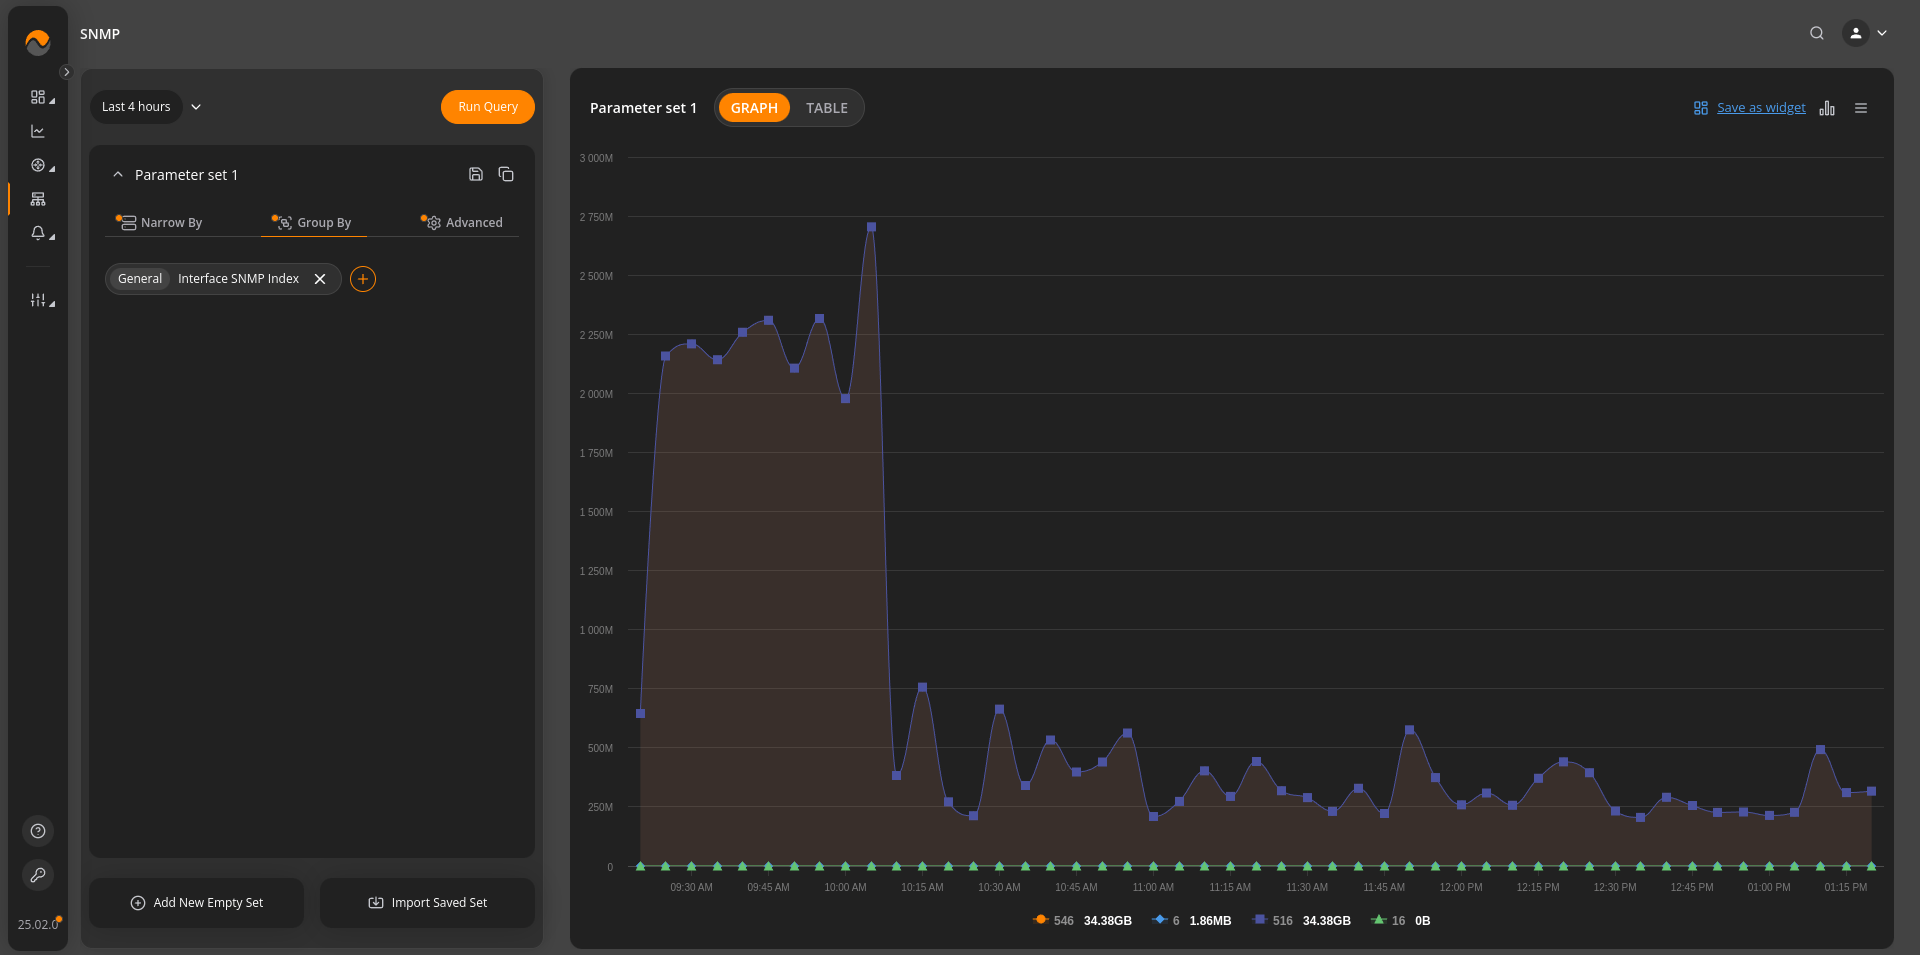
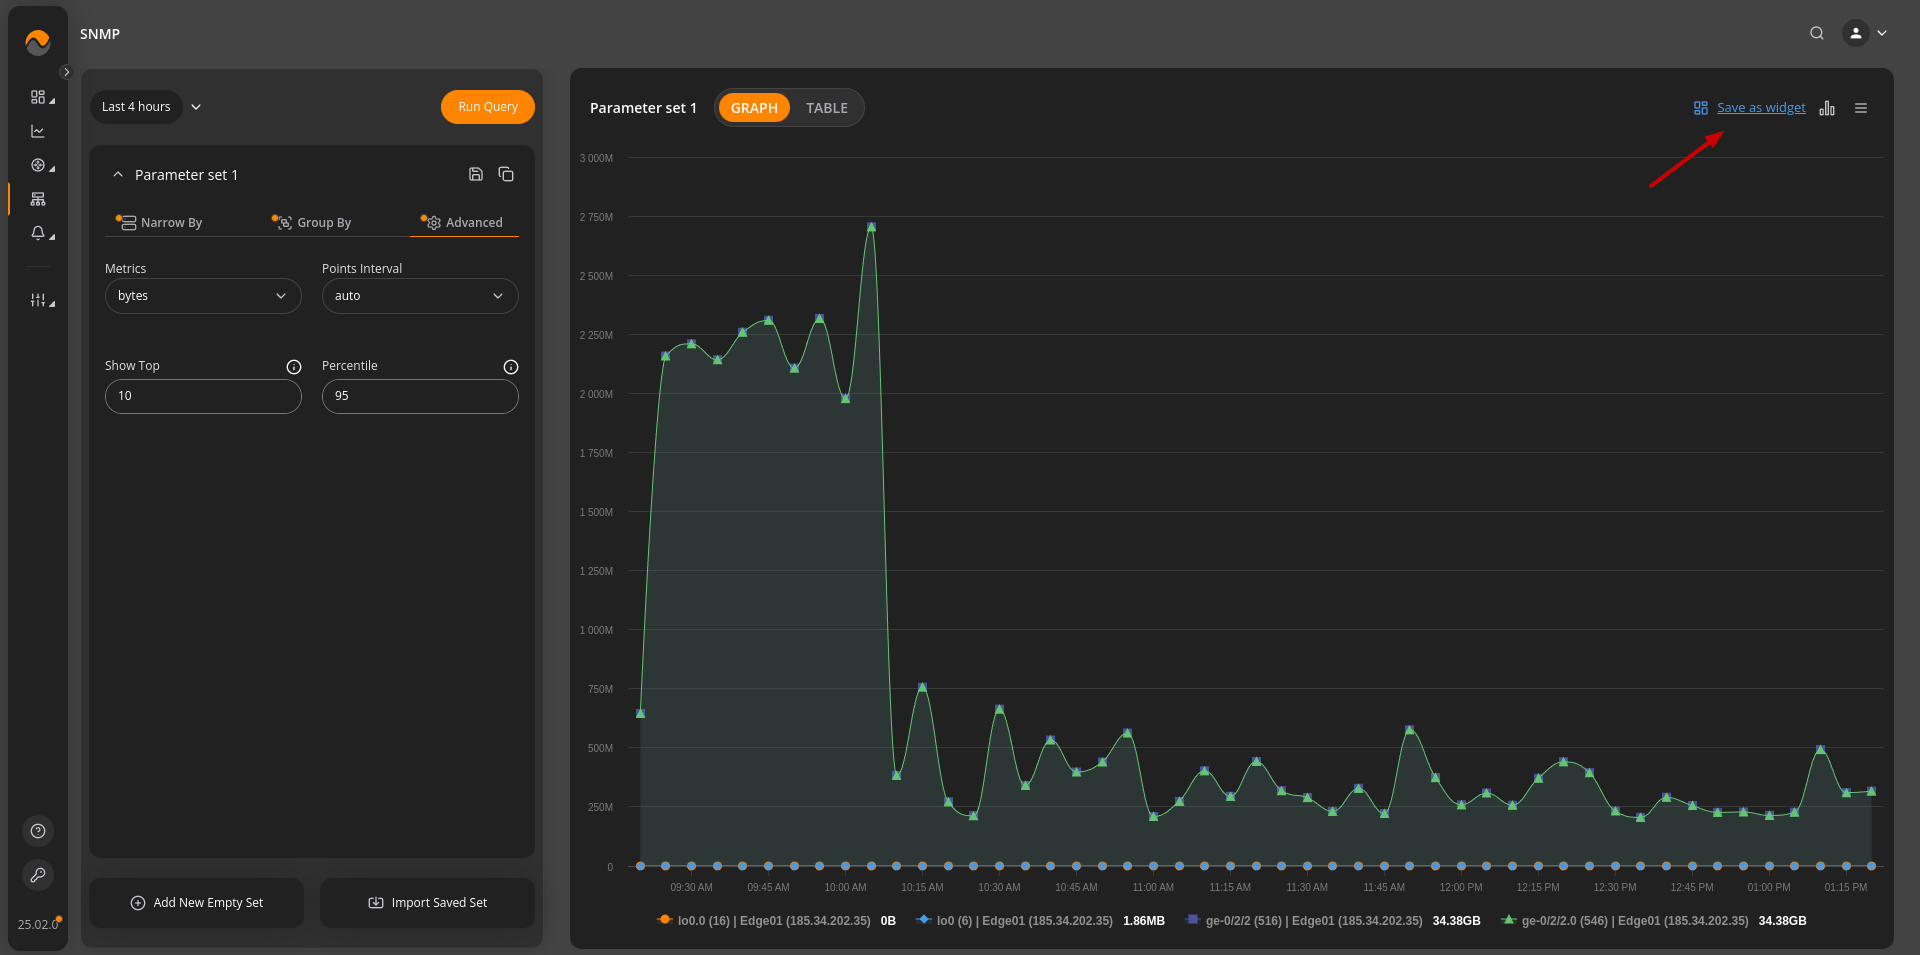
The data can be visualized in graph format also. This comprehensive view enables clear and insightful data visualization.
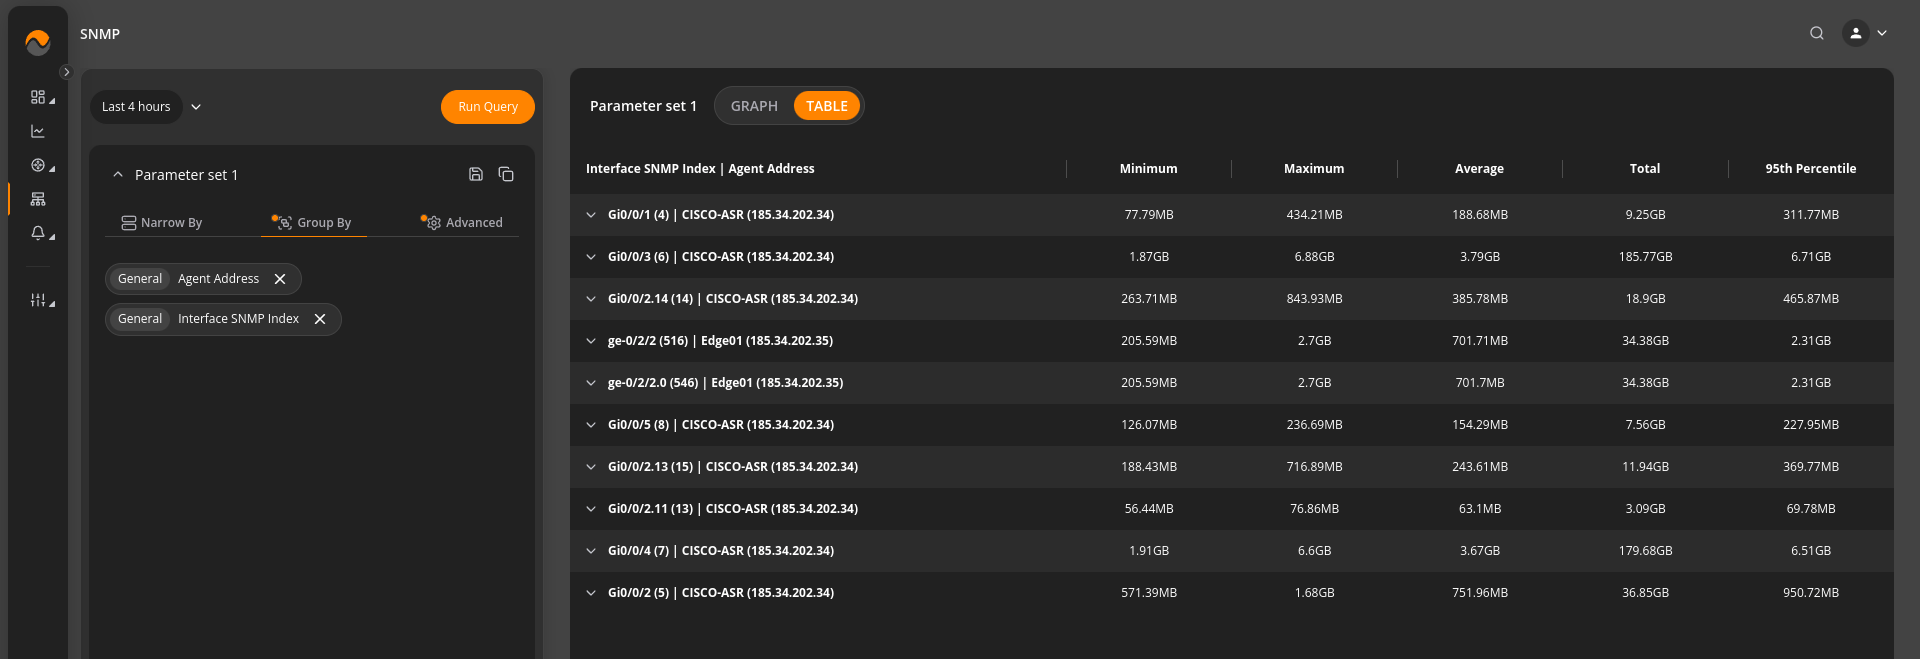
In this use case, we can select all interfaces from a device and group the data by the interface SNMP Index. The data is presented in both table and graph formats, providing a clear and comprehensive view.
Data is displayed also in graph mode.
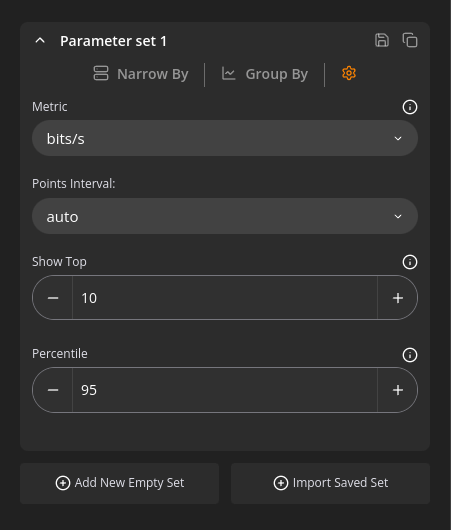
Click the Gear icon to open up Settings for a specific Parameter Set. Select the desired metric to be displayed. Choose the points interval for the graph, e.g. auto, hour, day, week, etc. You can also limit the graph/table to show the desired top N results (top 10 is the default value) for a simplified and more focused data visualization.
The available metrics include:
- octets
- octets/s
- unicast packets
- unicast packets/s
- bits
- bits/s
The available points intervals include:
- auto
- hour
- day
- week
- month
- year
Additionally, we can specify the number of values to be displayed in both the table and the graph in Show Top field (by default 10).
A functionality for SNMP includes the ability to specify percentile, which is then visualized as a plotline on the graph, providing a clear representation of the percentile distribution. The advantage of using percentiles in SNMP monitoring is that it allows for a more nuanced view of network performance by highlighting data distribution rather than just average or peak values.
To save a specific Parameter set, click on “Save button”.

In Save Parameter Set provide the following information:
- Name
- Description
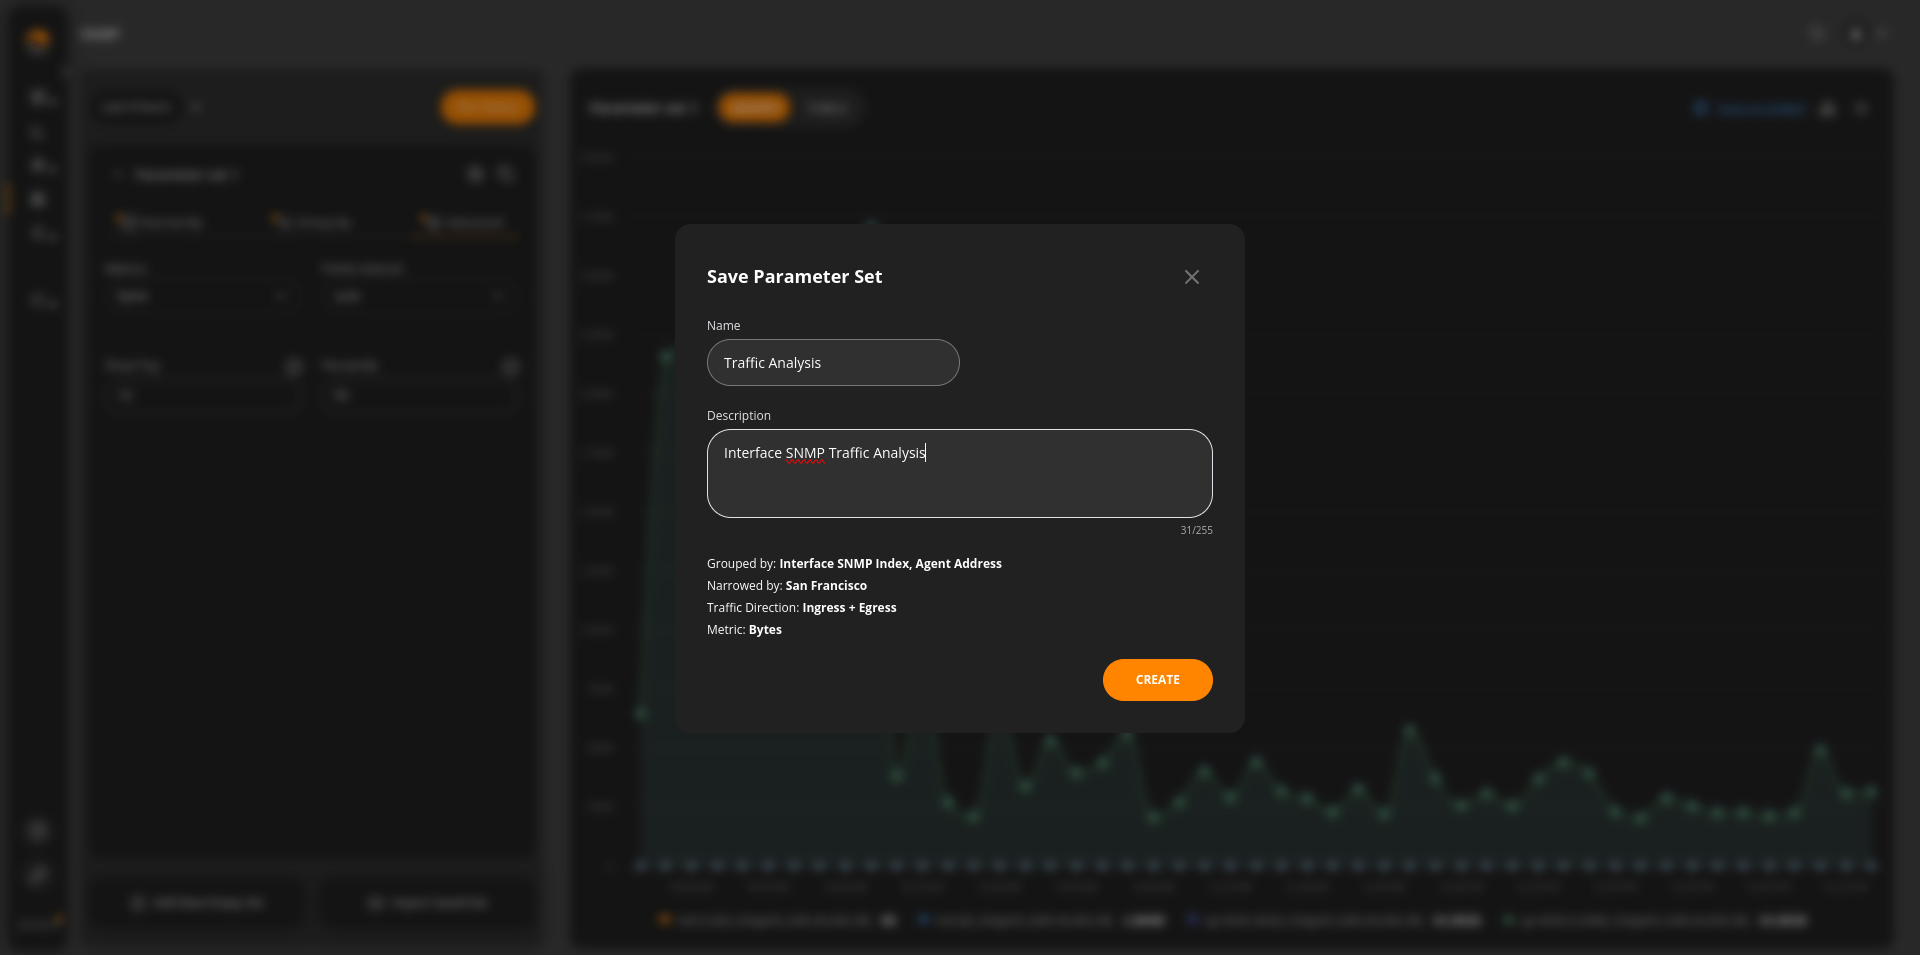
Saved Parameter Set you can find by clicking on “Import Saved Set”.
To display the widget on a specific dashboard, click on “Save changes.”
We should fill out the following fields for the widget:
- Name
- Description
If you want this widget to be visible to everyone, you can check the “Shared” checkbox.
Select the dashboards where you want the widget to appear and set the Refresh Interval (default is 5 minutes). Information about parameters is also displayed.
Once you’ve completed all the necessary settings for the widget, click on the “CREATE” button.

The widget is showcased on the Predefined dashboard.