Border Gateway Protocol (BGP) is not merely a protocol—it’s the backbone of the...


Request a personalized demo/review session of our Intelligent Routing Platform

Evaluate Noction IRP, and see how it meets your network optimization challenges

Schedule a one-on-one demonstration of our network traffic analysis product

Test drive NFA today with your own fully featured 30-day free trial
NFA main page is designed to display a dashboard of choice and offer facilities to access all application features via its main menu, navigation buttons, and links. Use Global Search (Ctrl K) to effortlessly steer the application using keyboard shortcuts.
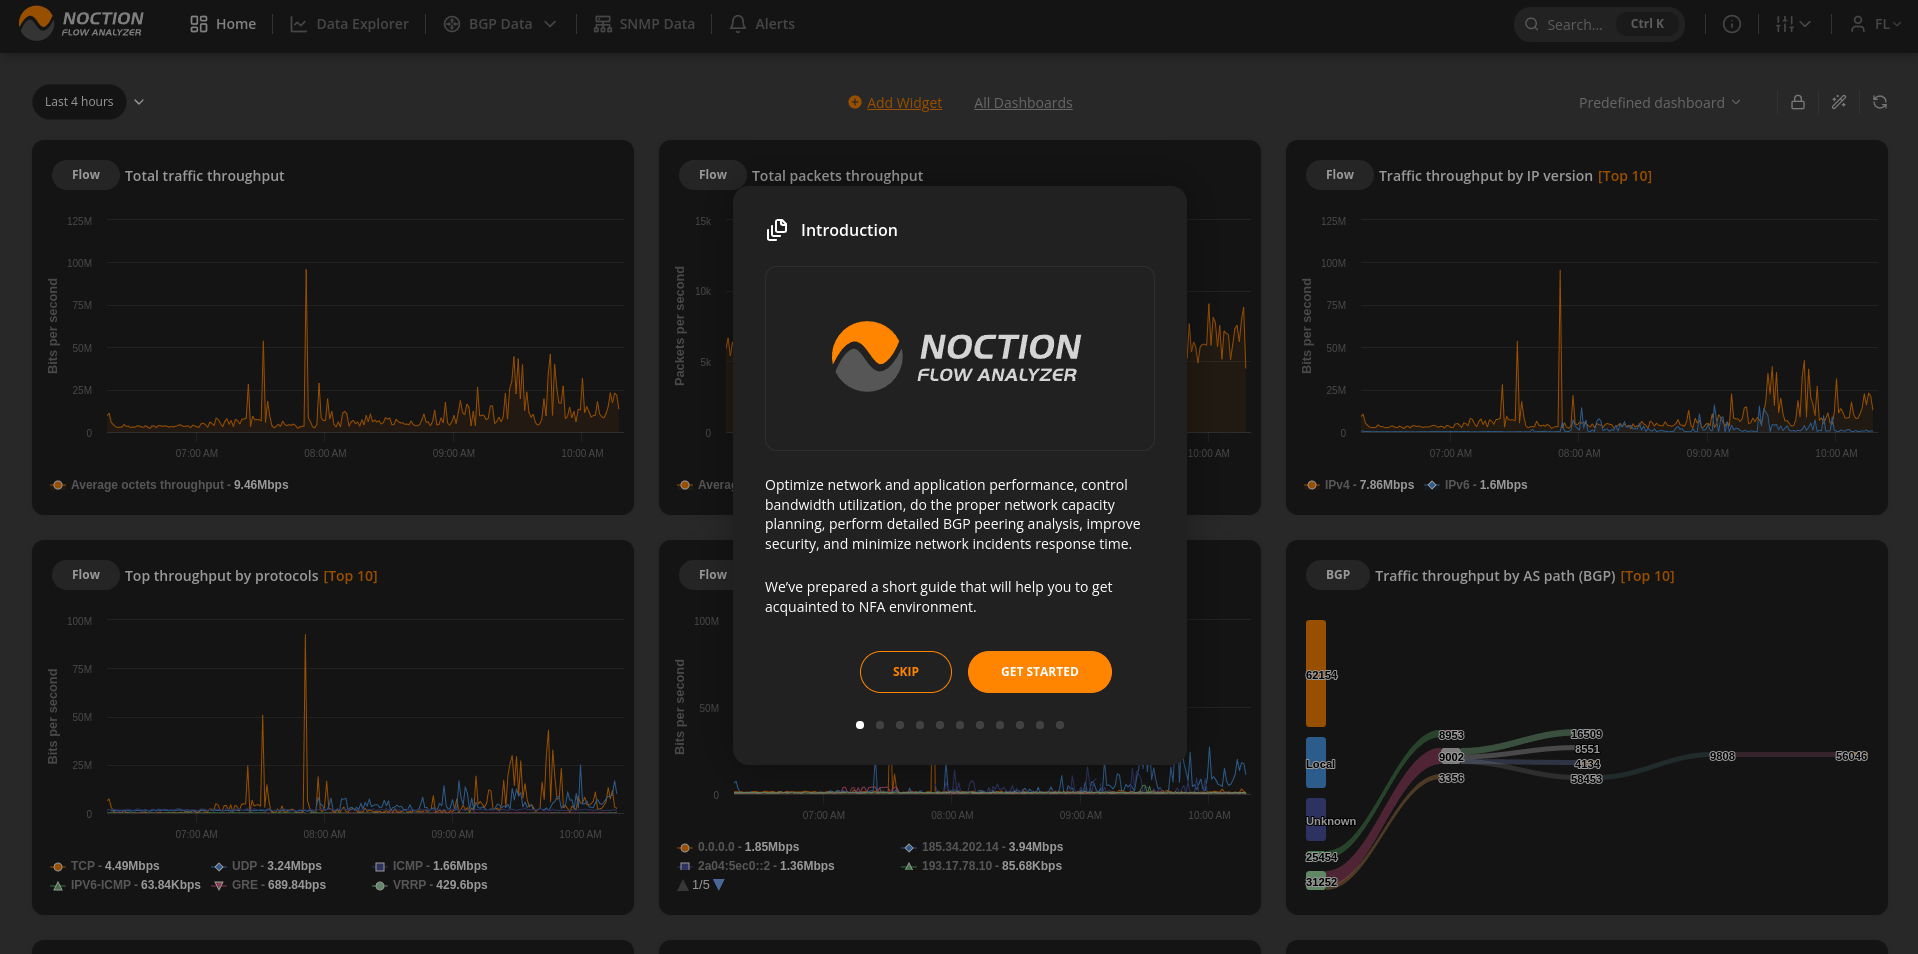
When installing NFA for the first time, a Welcome Wizard pops up on the screen. It showcases and guides you through the system, displaying the list of available NFA features and how they work. This makes the first-time user understand all the product capabilities & configuration procedures a lot easier and faster.
If at any time you decide to go through the wizard steps again, you can do so by navigating to your Username > Profile > General and restarting the wizard.
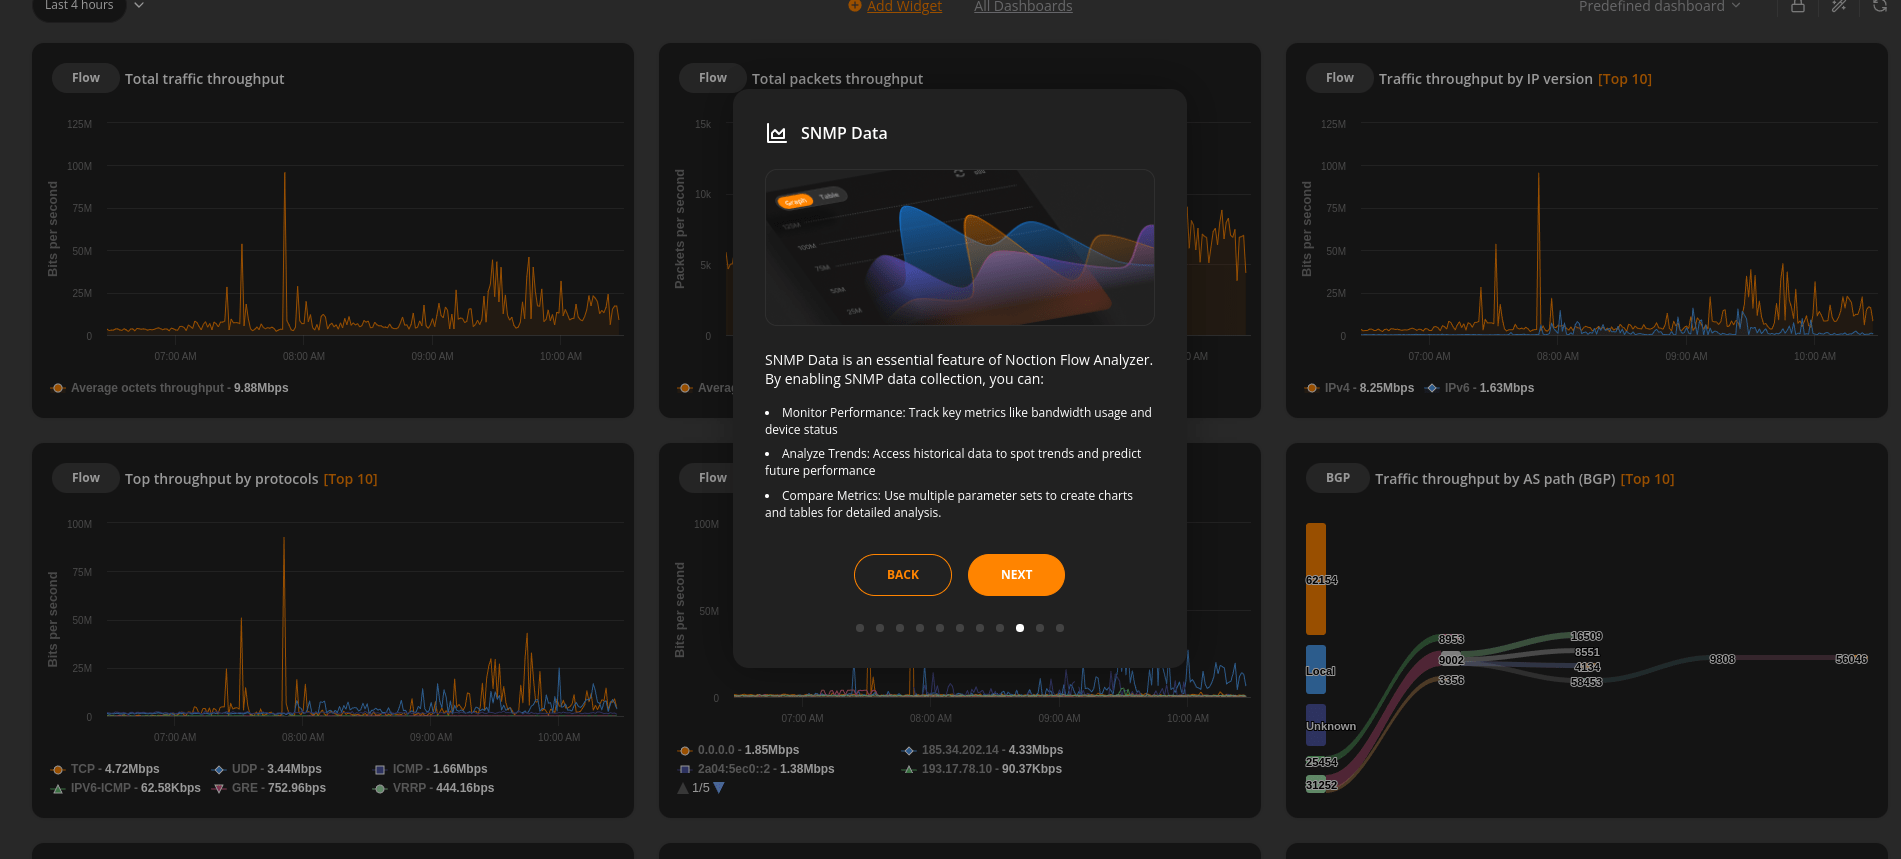
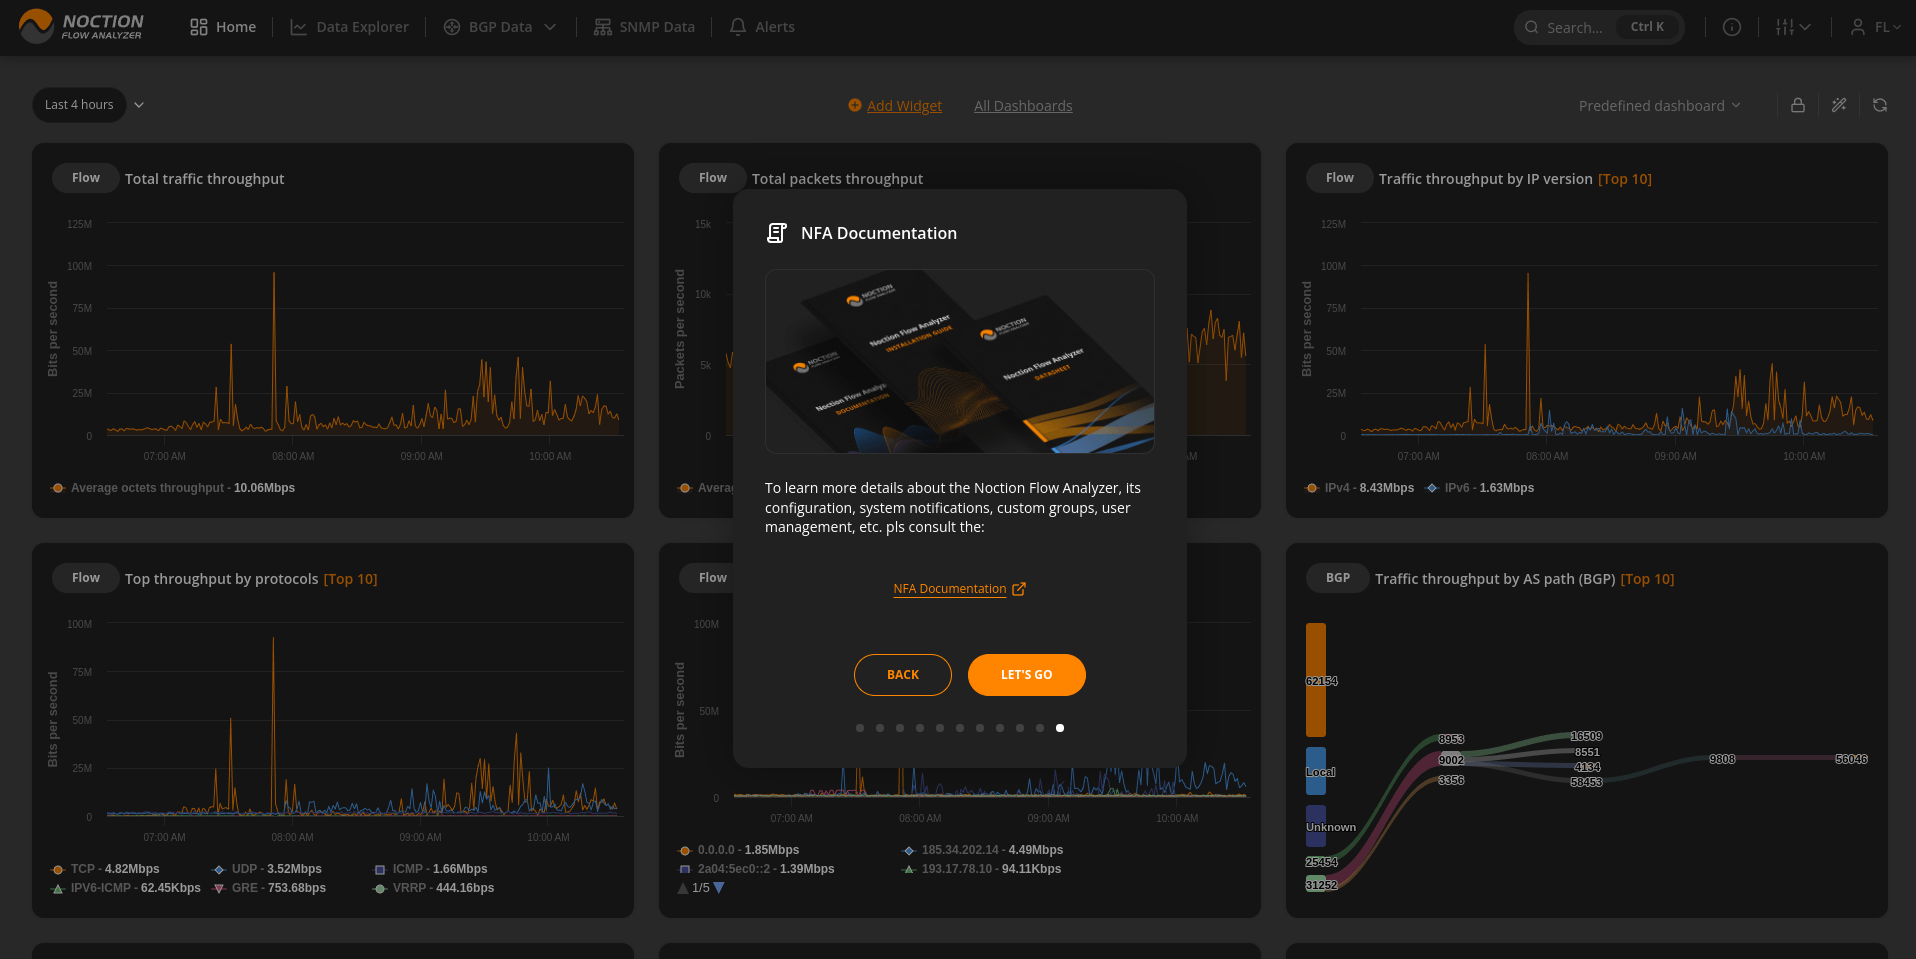
When you click on “Get Started,” you’ll be guided through key information about NFA. The first step introduces you to Licensing, where you can view your License status, ID, and even change the license. Next, you’ll have the option to customize your theme, choosing between light, dark, or auto modes. As you continue, you’ll explore the main resources and functionalities of NFA, including Adding/Editing Devices, NFA Dashboards, Data Explorer, Alerts, BGP Data, SNMP Data, and SSL/TLS Certificates. An example you can see in the image below.
Additionally, the Welcome Wizard provides easy access to the NFA Documentation, ensuring you have all the resources you need at your fingertips.
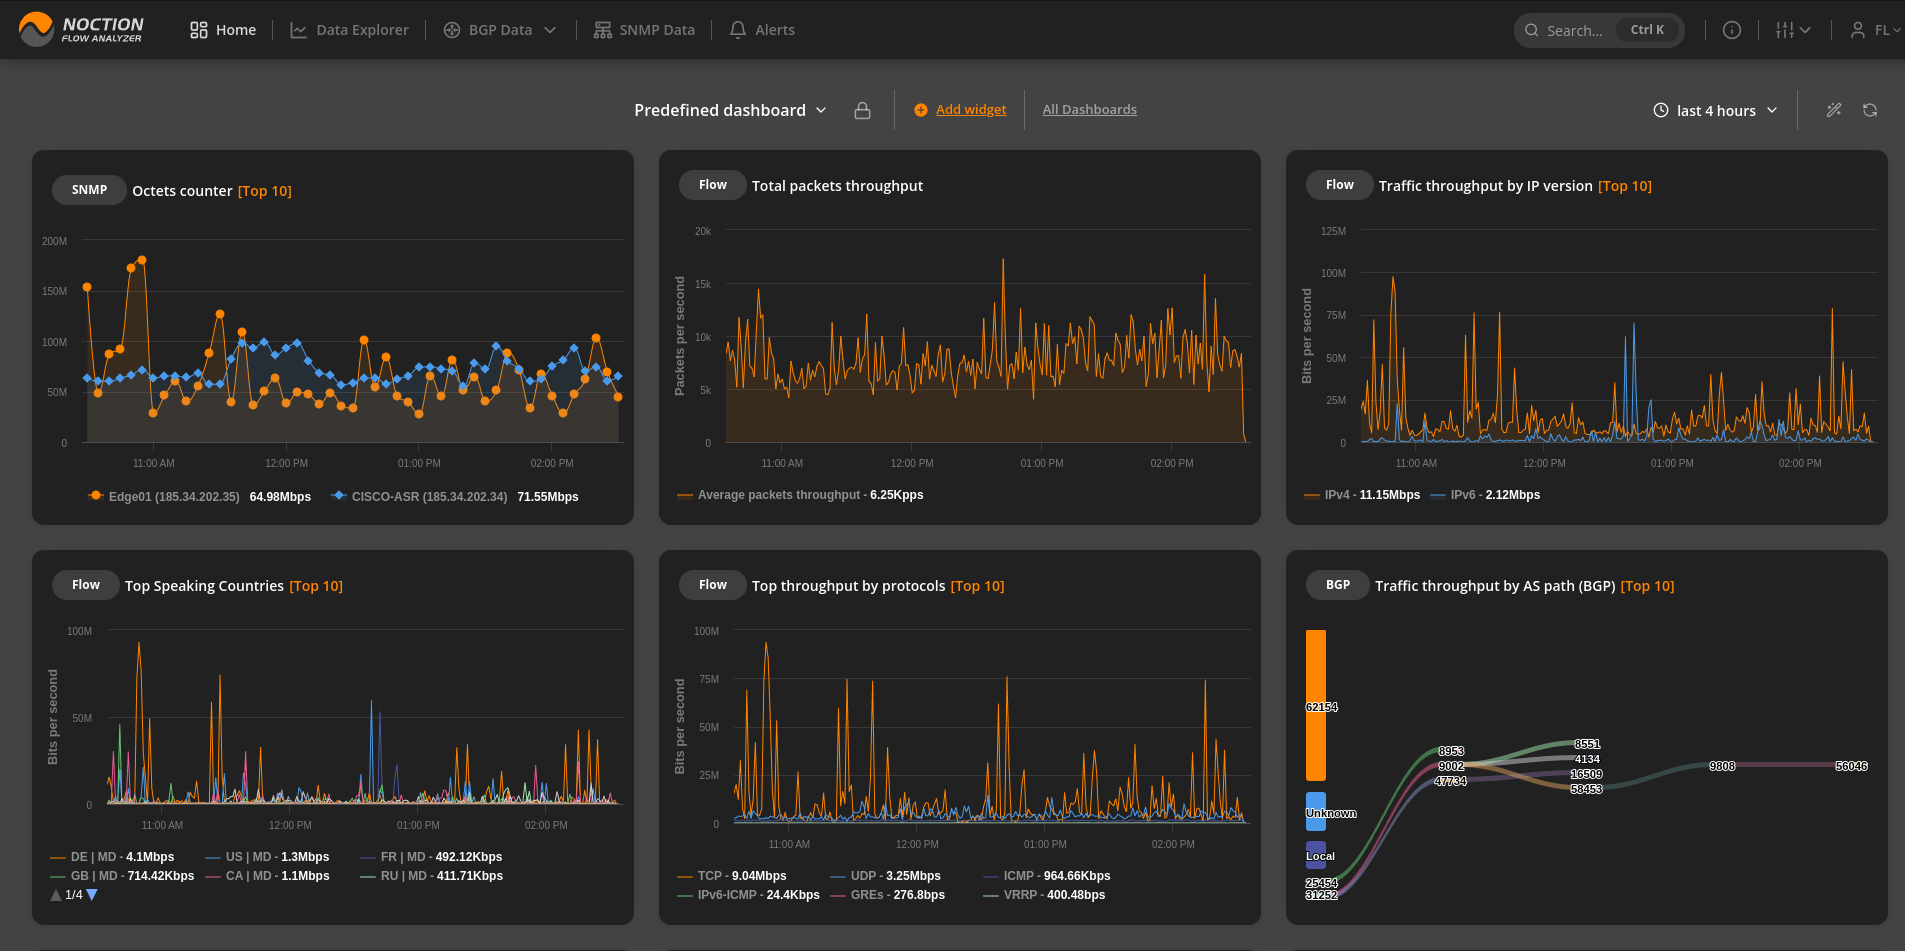
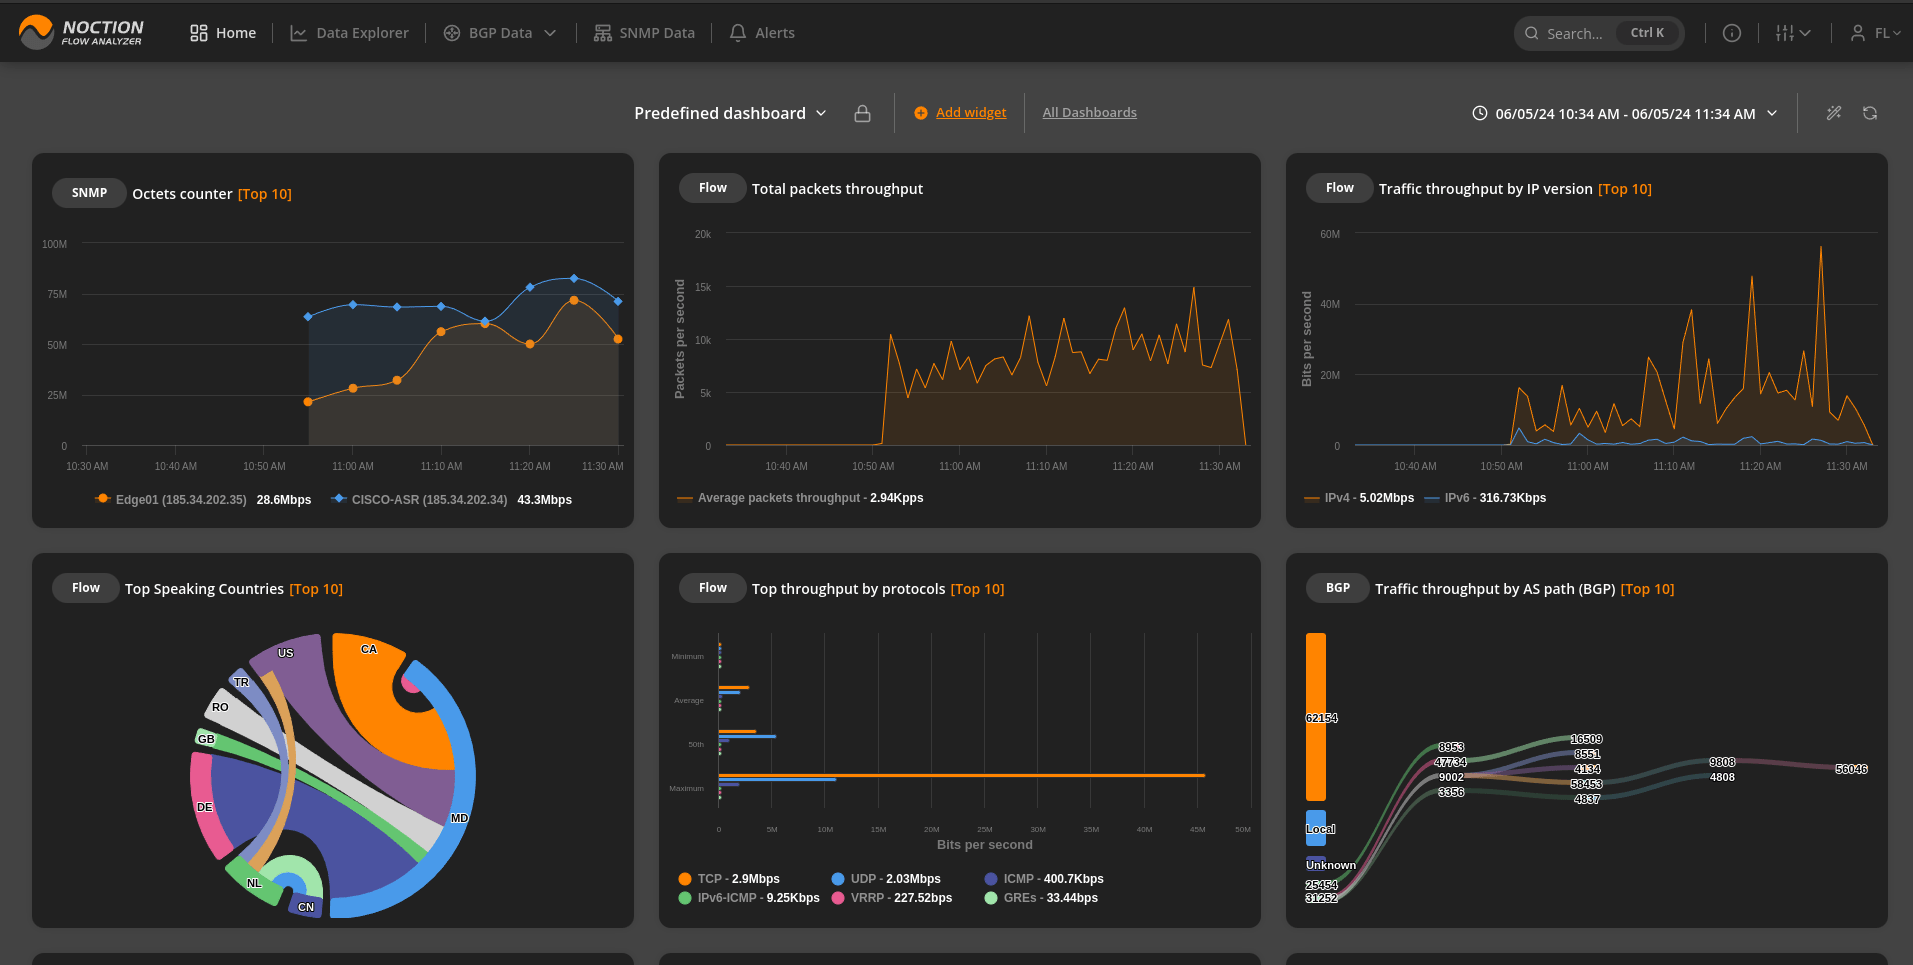
NFA dashboards are the specific sets of flexible and interactive visualizations, designed for quick analysis of the network traffic data and informational awareness. Dashboards consist of widgets – containers with graphical representations of specific data, which can be added, edited, positioned, deleted or modified as you like.
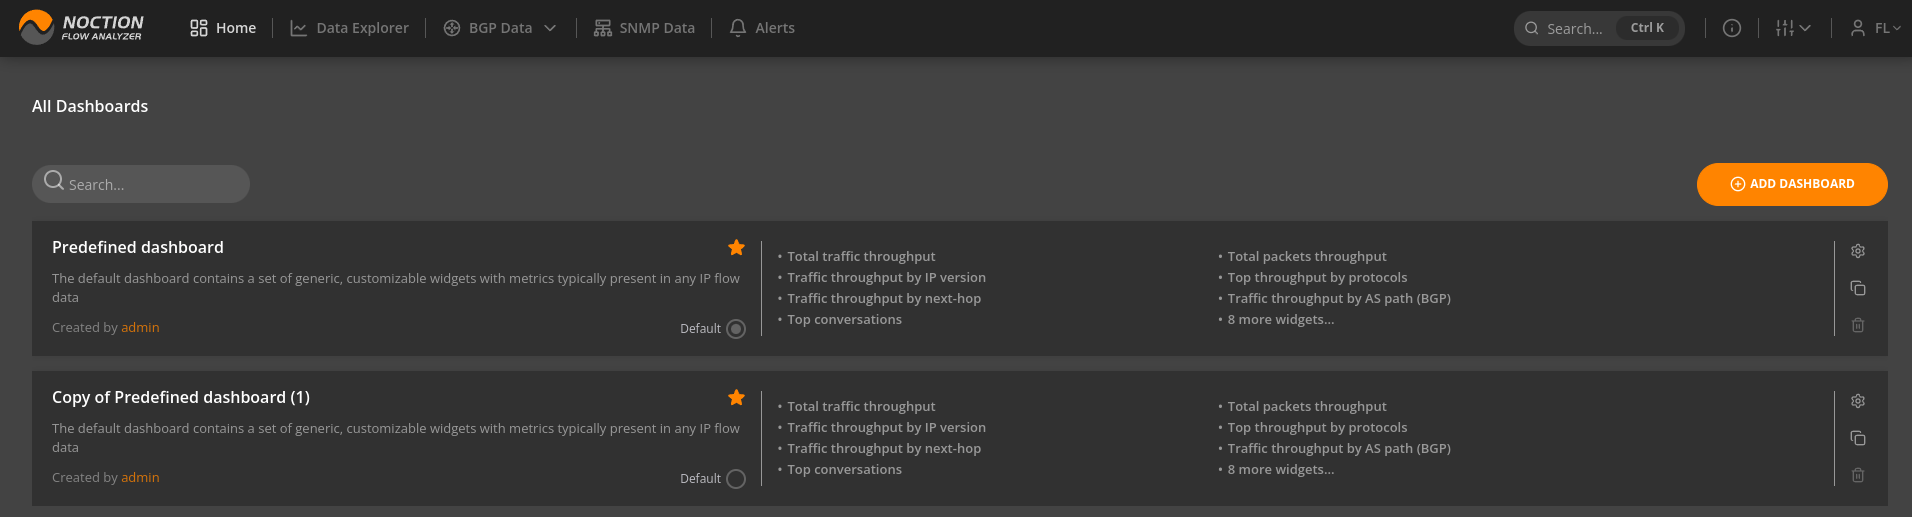
NFA allows users to set up multiple dashboards. To see a list of existing dashboards, click the All Dashboards link in the top menu.
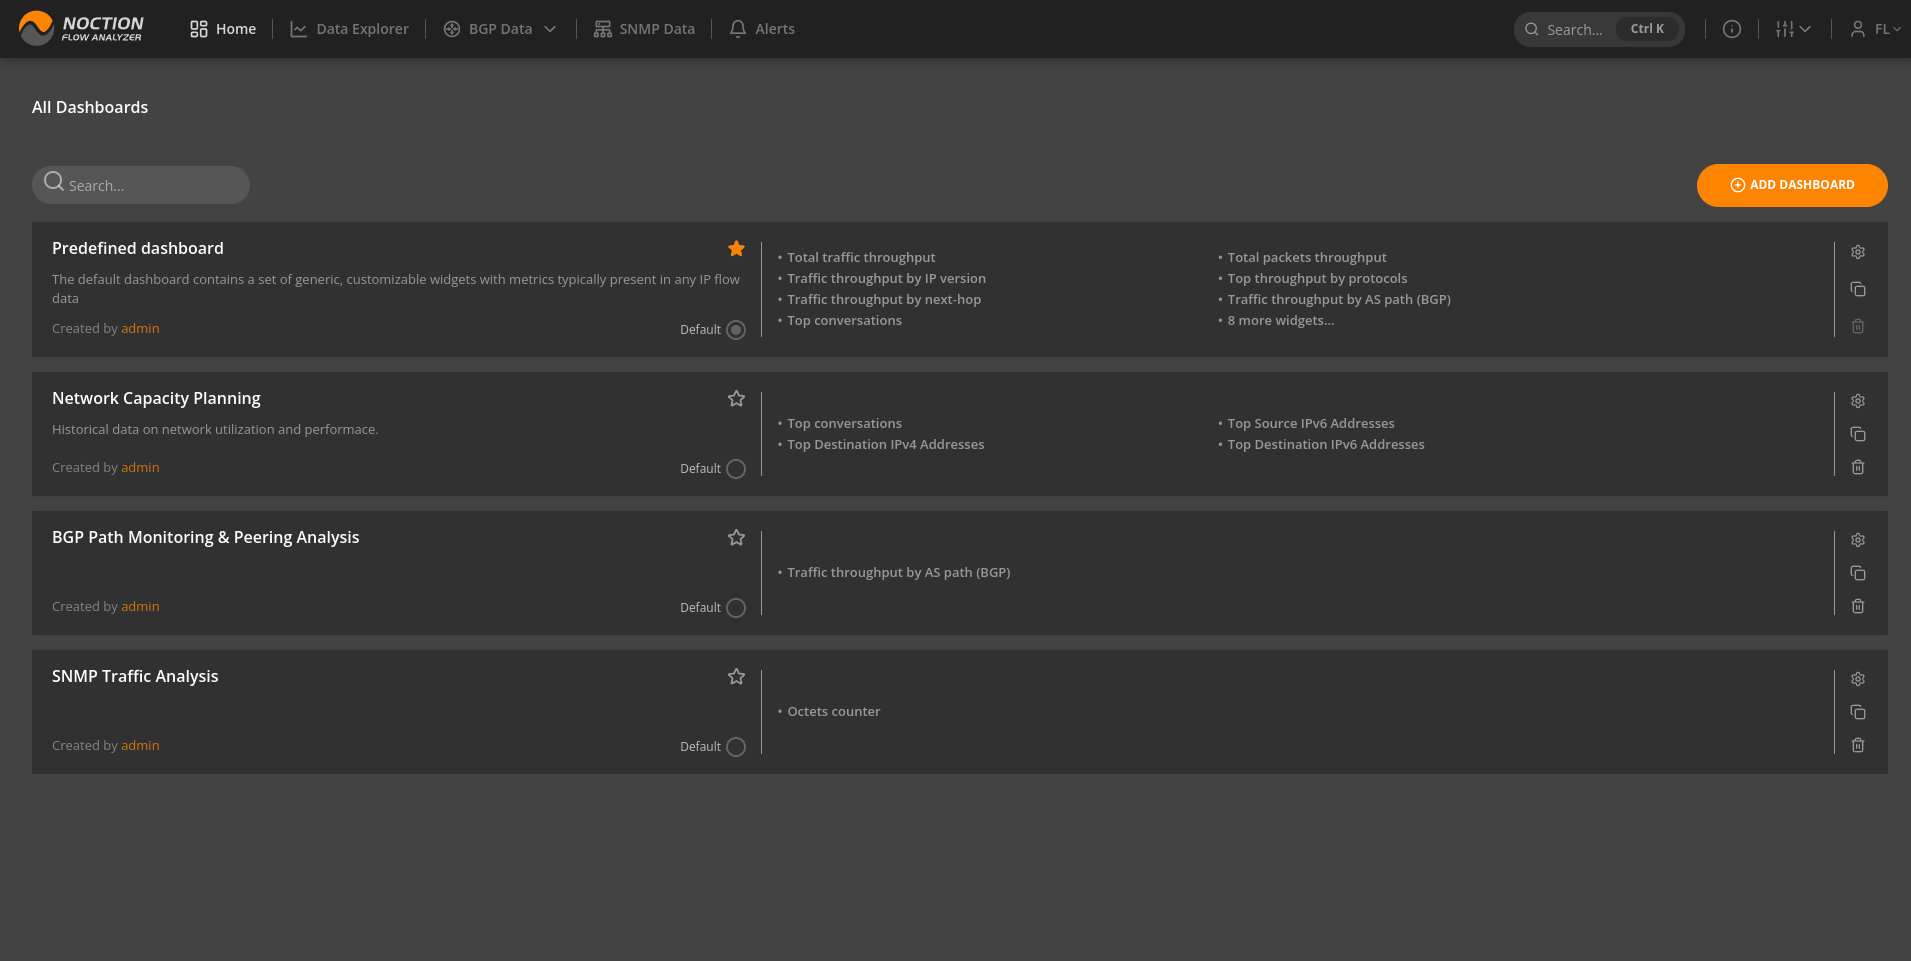
You can easily create a new dashboard in NFA from the All Dashboards directory.
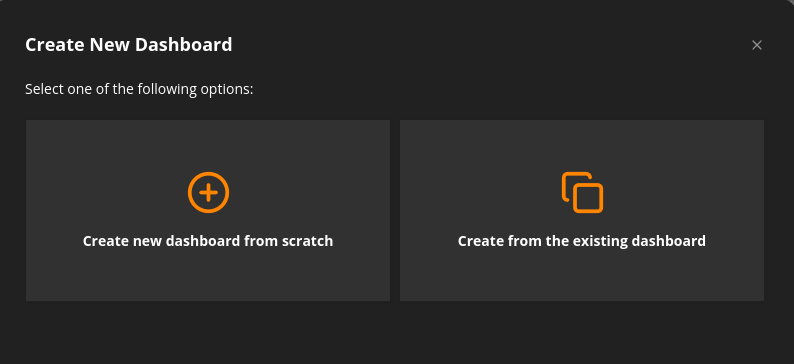
Click the “ADD DASHBOARD” button. A pop-up will appear. Choose if you’d like to create a dashboard from scratch or build one based on an existing dashboard.
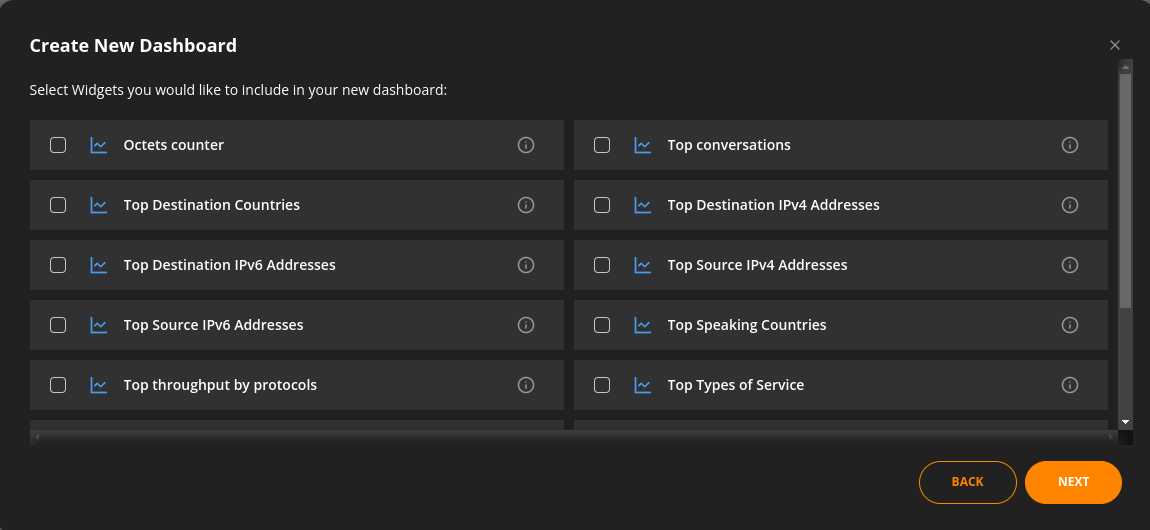
Select the widgets you’d like to add to your dashboard.
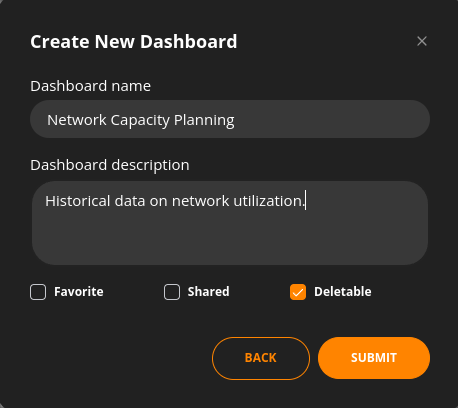
Provide a meaningful name and description for your dashboard. Mark if you’d prefer it to be a “Shared” (all NFA users will have access to dashboard) and/or “Favorite” dashboard.If you want the dashboard to be deletable, check ,,Deletable”. Press “SUBMIT” to continue.
Alternatively, you can create a new dashboard by cloning an existing one in the All Dashboards directory.
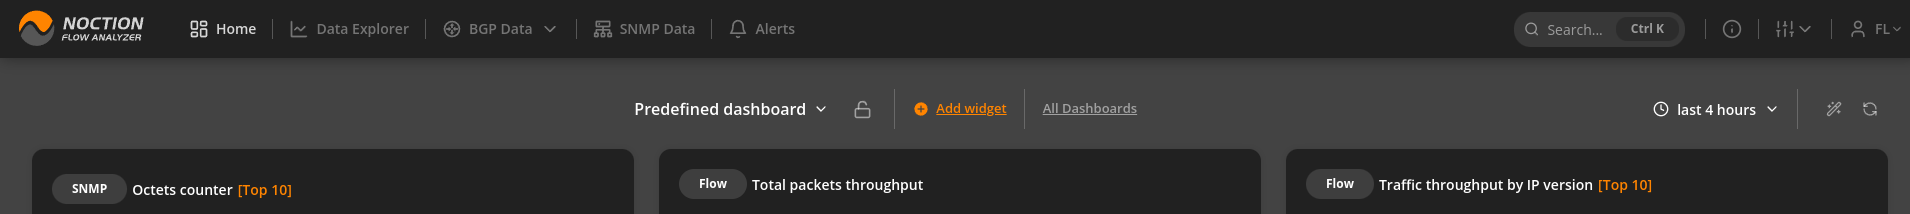
Access any of the dashboards you’ve created or had admin rights to. Click the padlock icon in the top menu to add, edit and delete widgets or customize the dashboard’s layout.
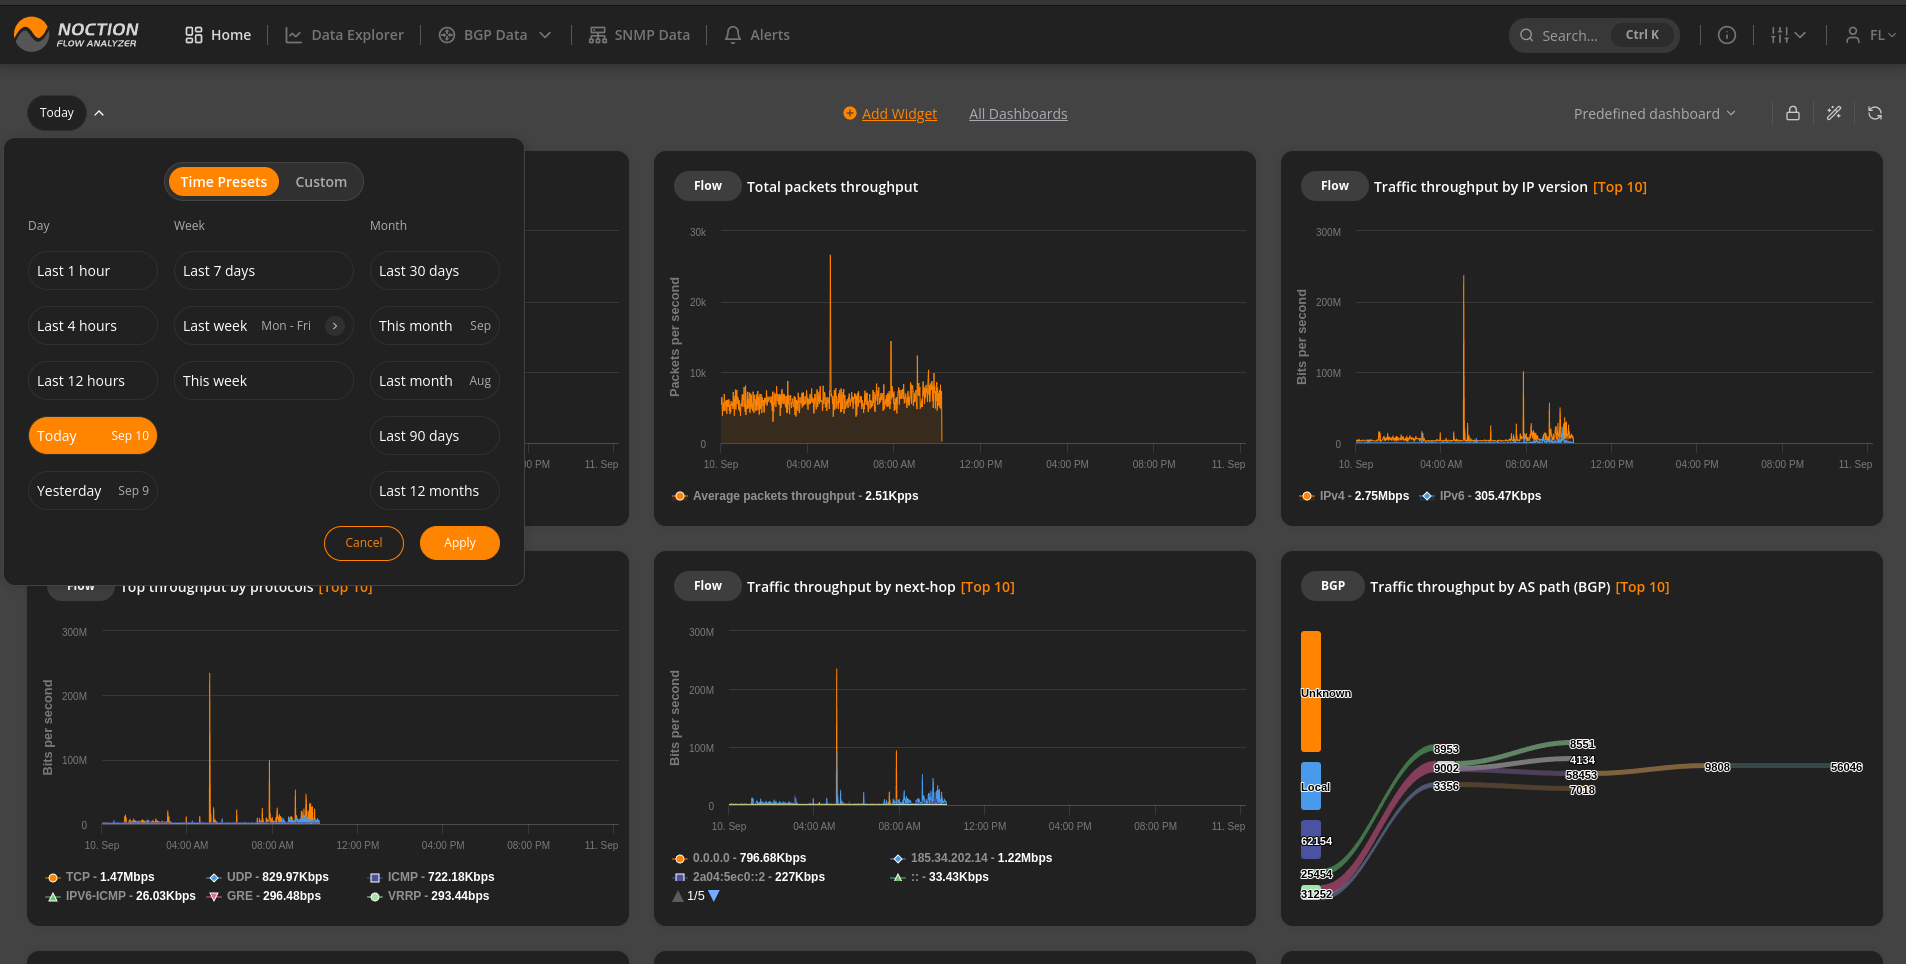
The Interval Picker, available on the Dashboard, Data Explorer, BGP Report, Sankey, and SNMP Report, offers users the ability to conveniently select specific time ranges. From the “Time Presets” option, users can quickly choose commonly used intervals such as a particular day, week, or month, making it easy to focus on the most relevant data.
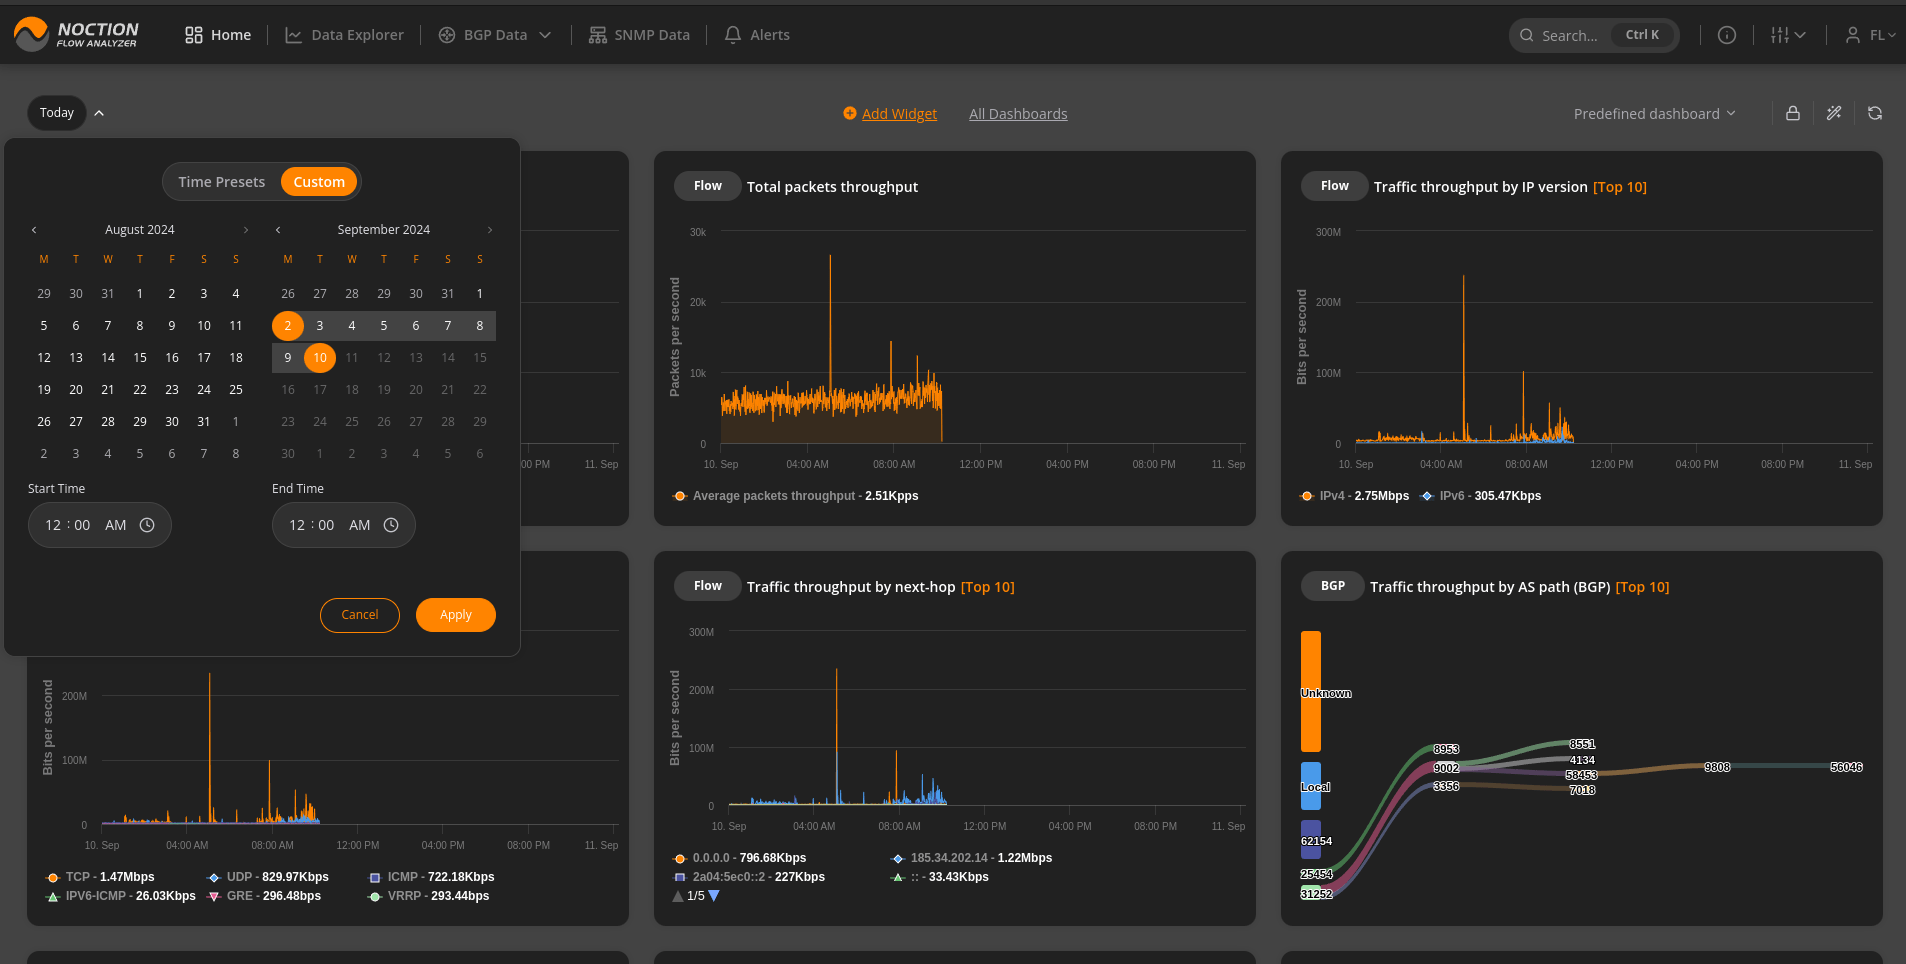
Additionally, users have the flexibility to define their own time range through the “Custom” option. By selecting specific start and end dates, they can tailor the time frame to their exact needs, offering greater precision and control over the data displayed.
Click the “Delete” icon on the dashboard you’d like to get rid of in the All Dashboards directory.
You can only delete a dashboard if you created it, or if you‘ve been granted the corresponding admin rights.
All network traffic information in NFA is graphically represented by widgets, which are the main dashboard elements. Widgets encompass a particular query focusing on the desired network feature. A library of widgets is maintained by NFA and allows users to reuse them across all dashboards.
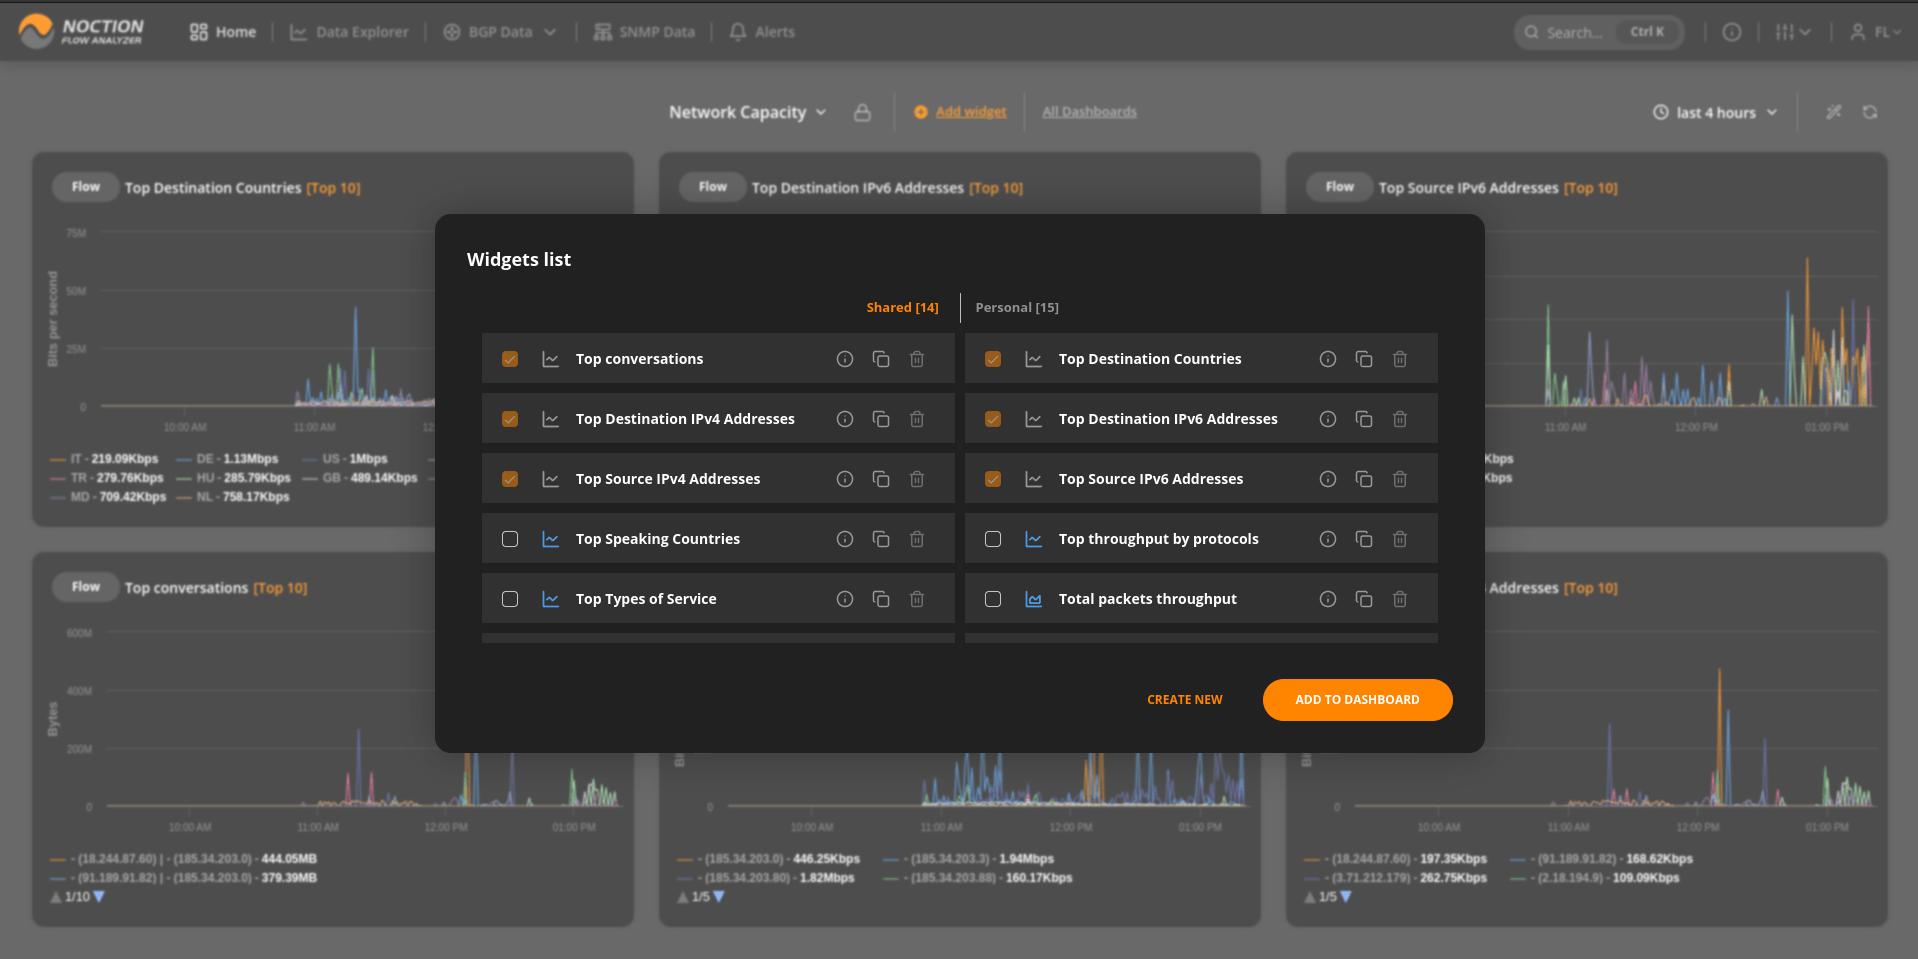
Use the Add Widget function available on each dashboard to see the library of existing widgets and place the desired ones on a dashboard.

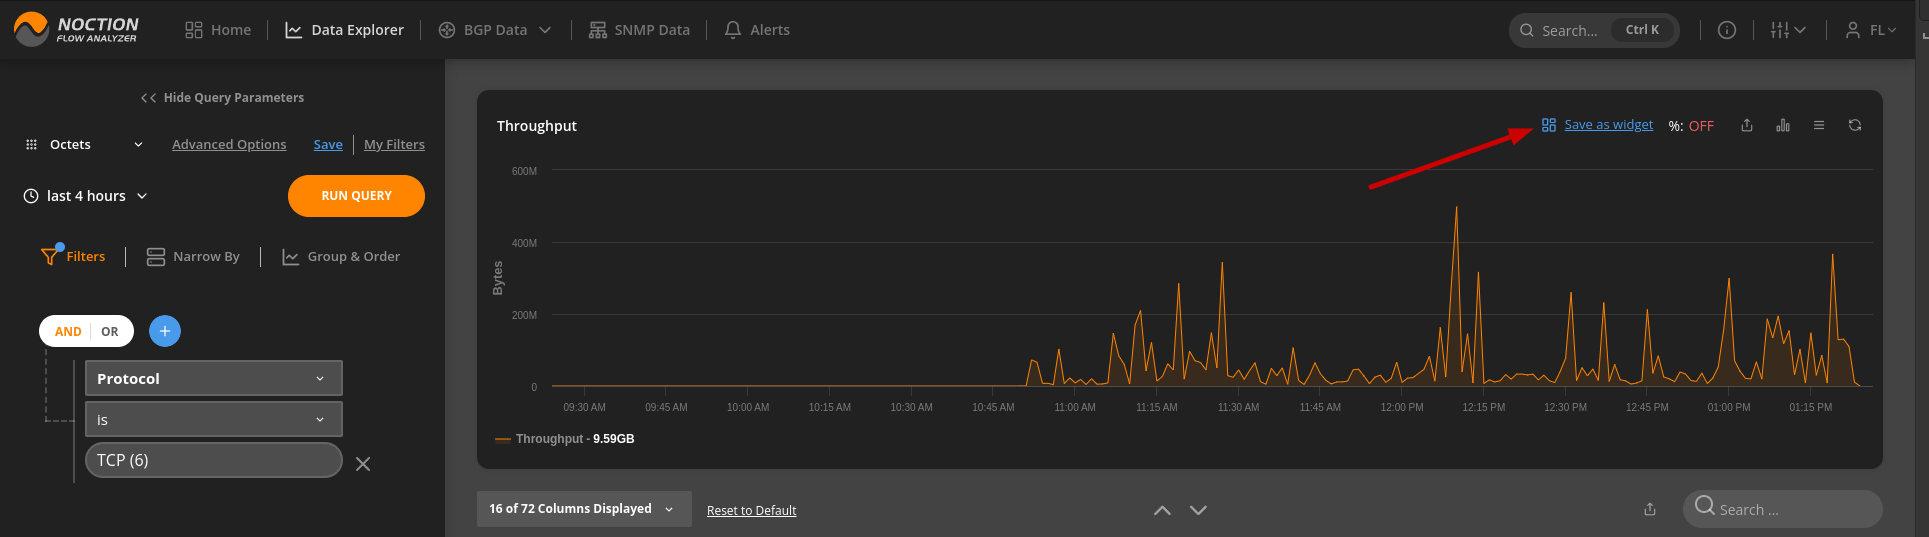
You can easily create a new widget from scratch by proceeding to Data Explorer in the top menu, selecting the filtering and grouping options and subsequently saving the Data Explorer view as a new widget to the desired dashboard.
Alternatively, you can create a new widget by duplicating an existing one. Click on the existing widget name to open it in Data Explorer. Make desired modifications and save it as a new widget.
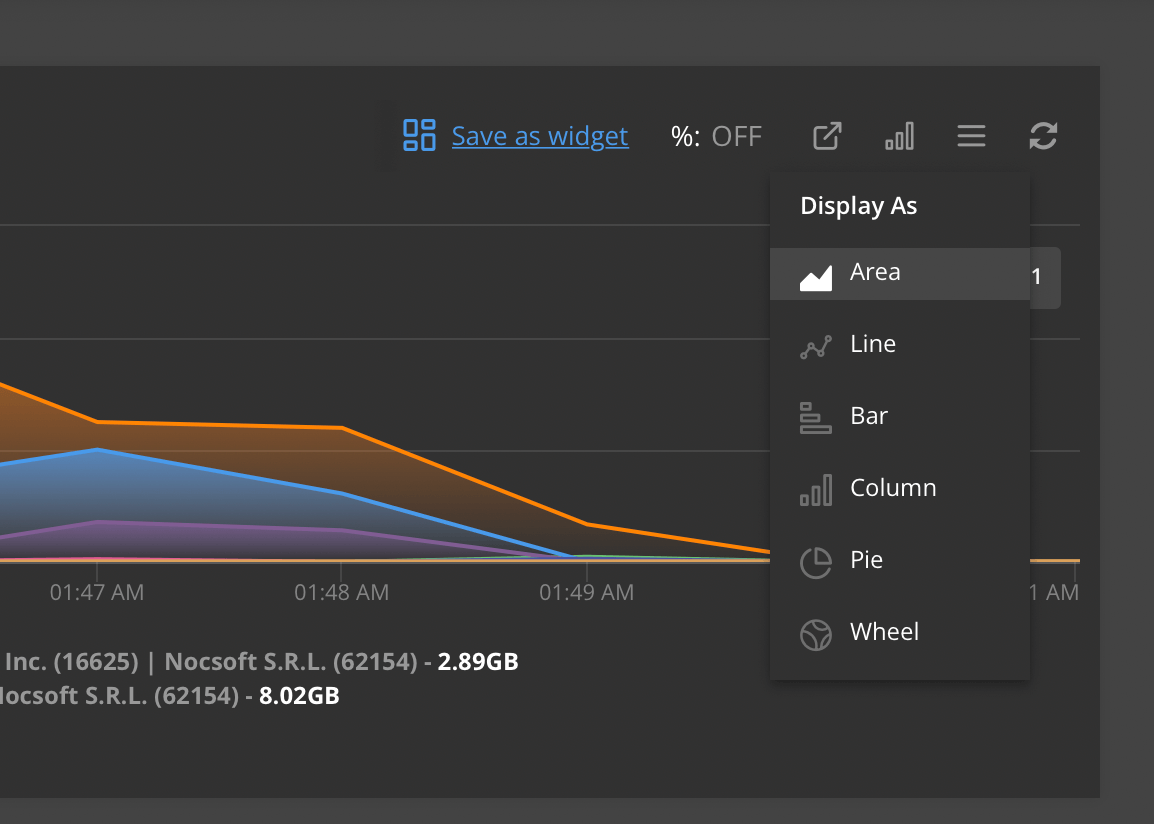
Feel free to change the widgets graph settings, appearance as well as the legend position by clicking the appropriate buttons in the top right corner of the Data Explorer graph or the actual widget.
To edit an existing widget, click the corresponding icon next to its name either in the widget library or on a dashboard. Please note that predefined widgets can not be edited.
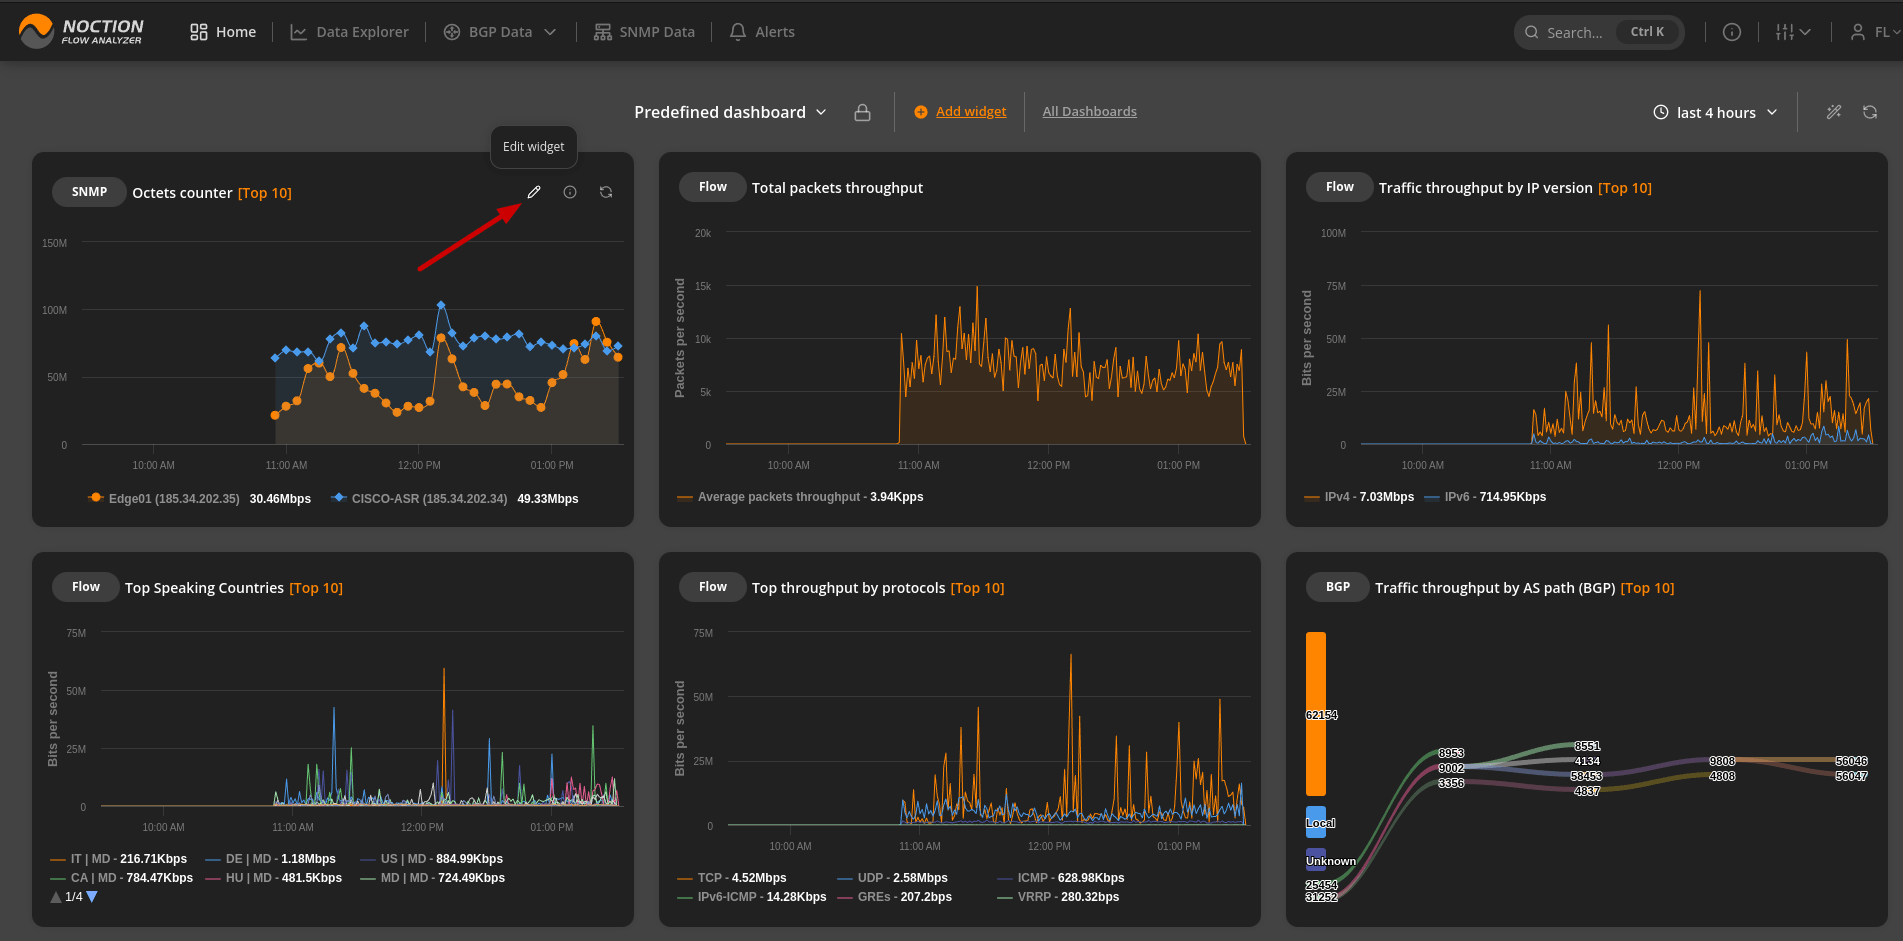
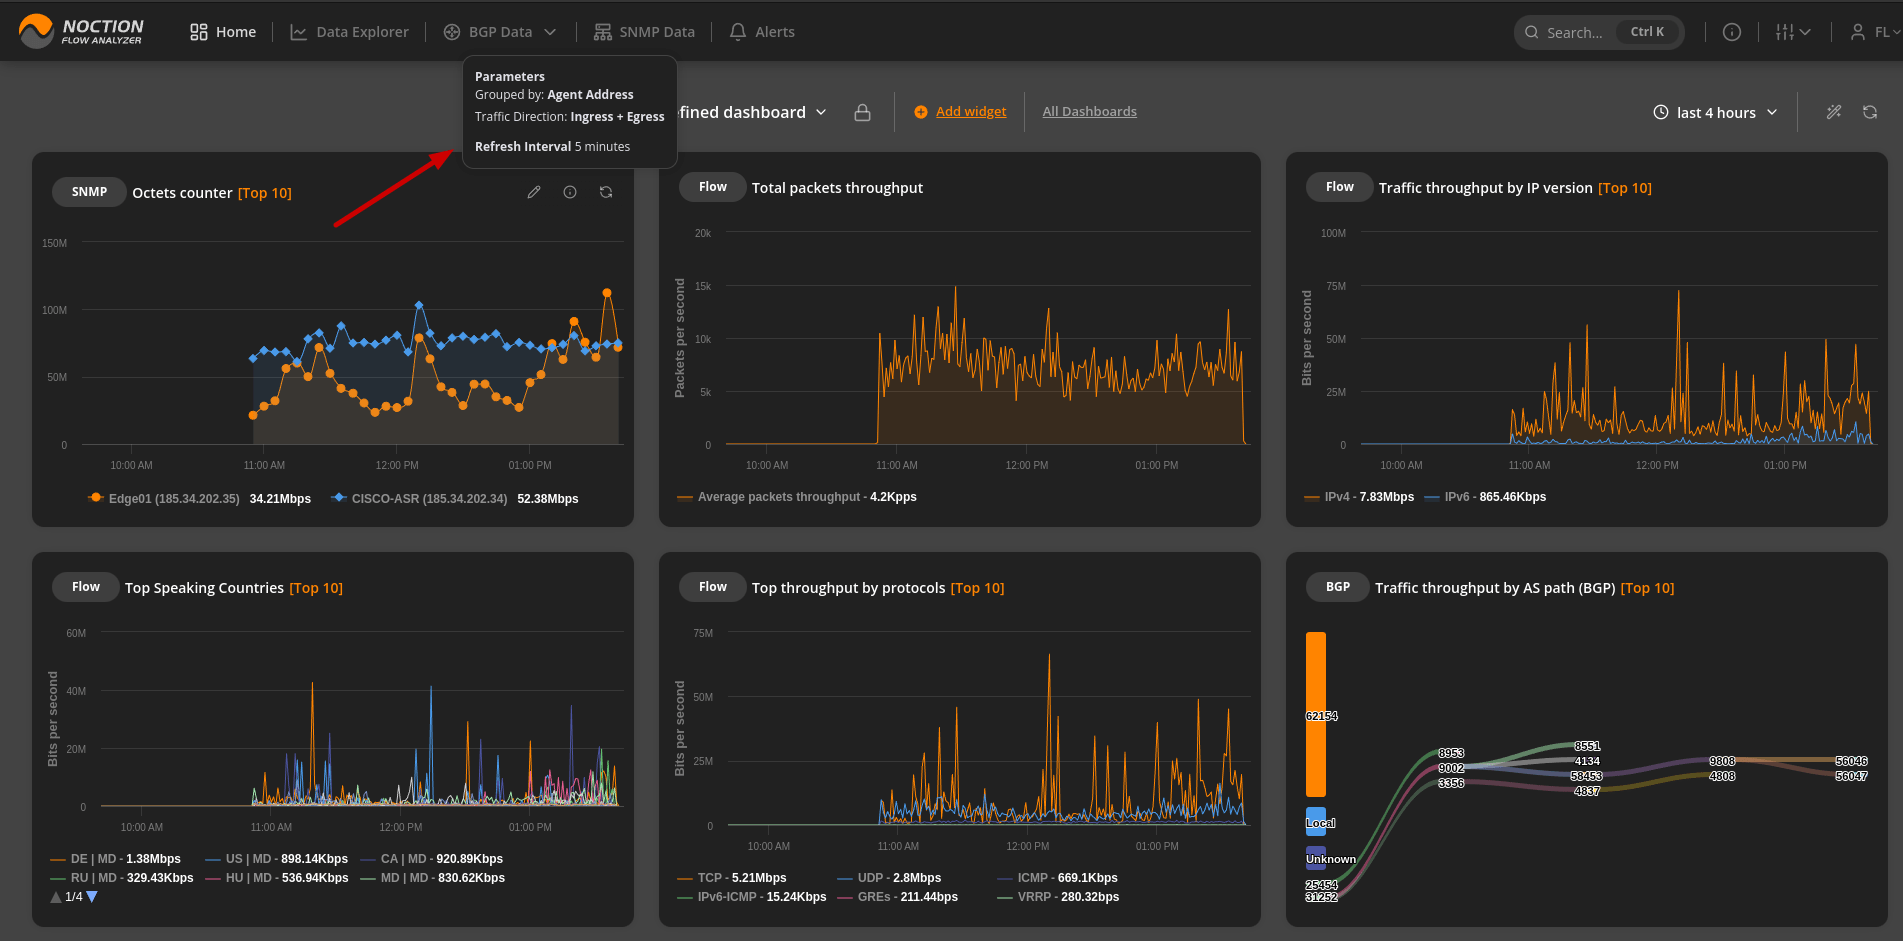
An information icon provides details about the widget, including parameters, filters and refresh interval. Also, you can keep the widget up to date by clicking the refresh icon.