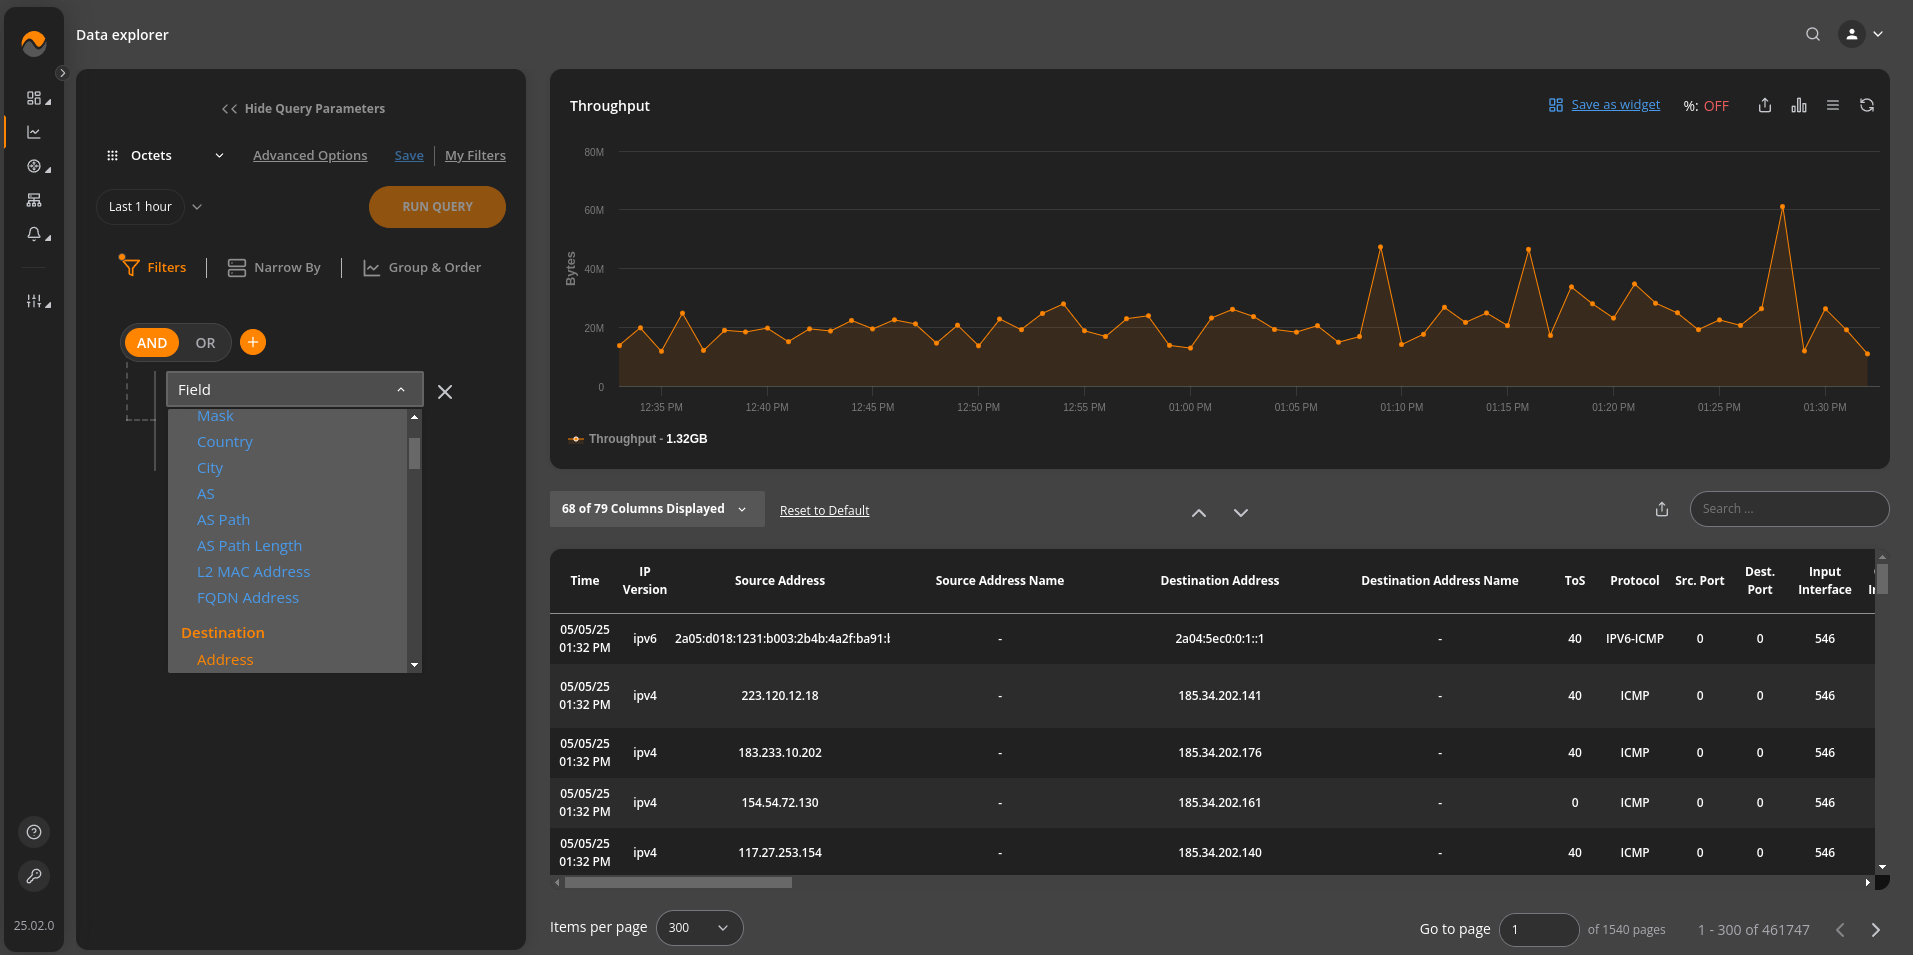
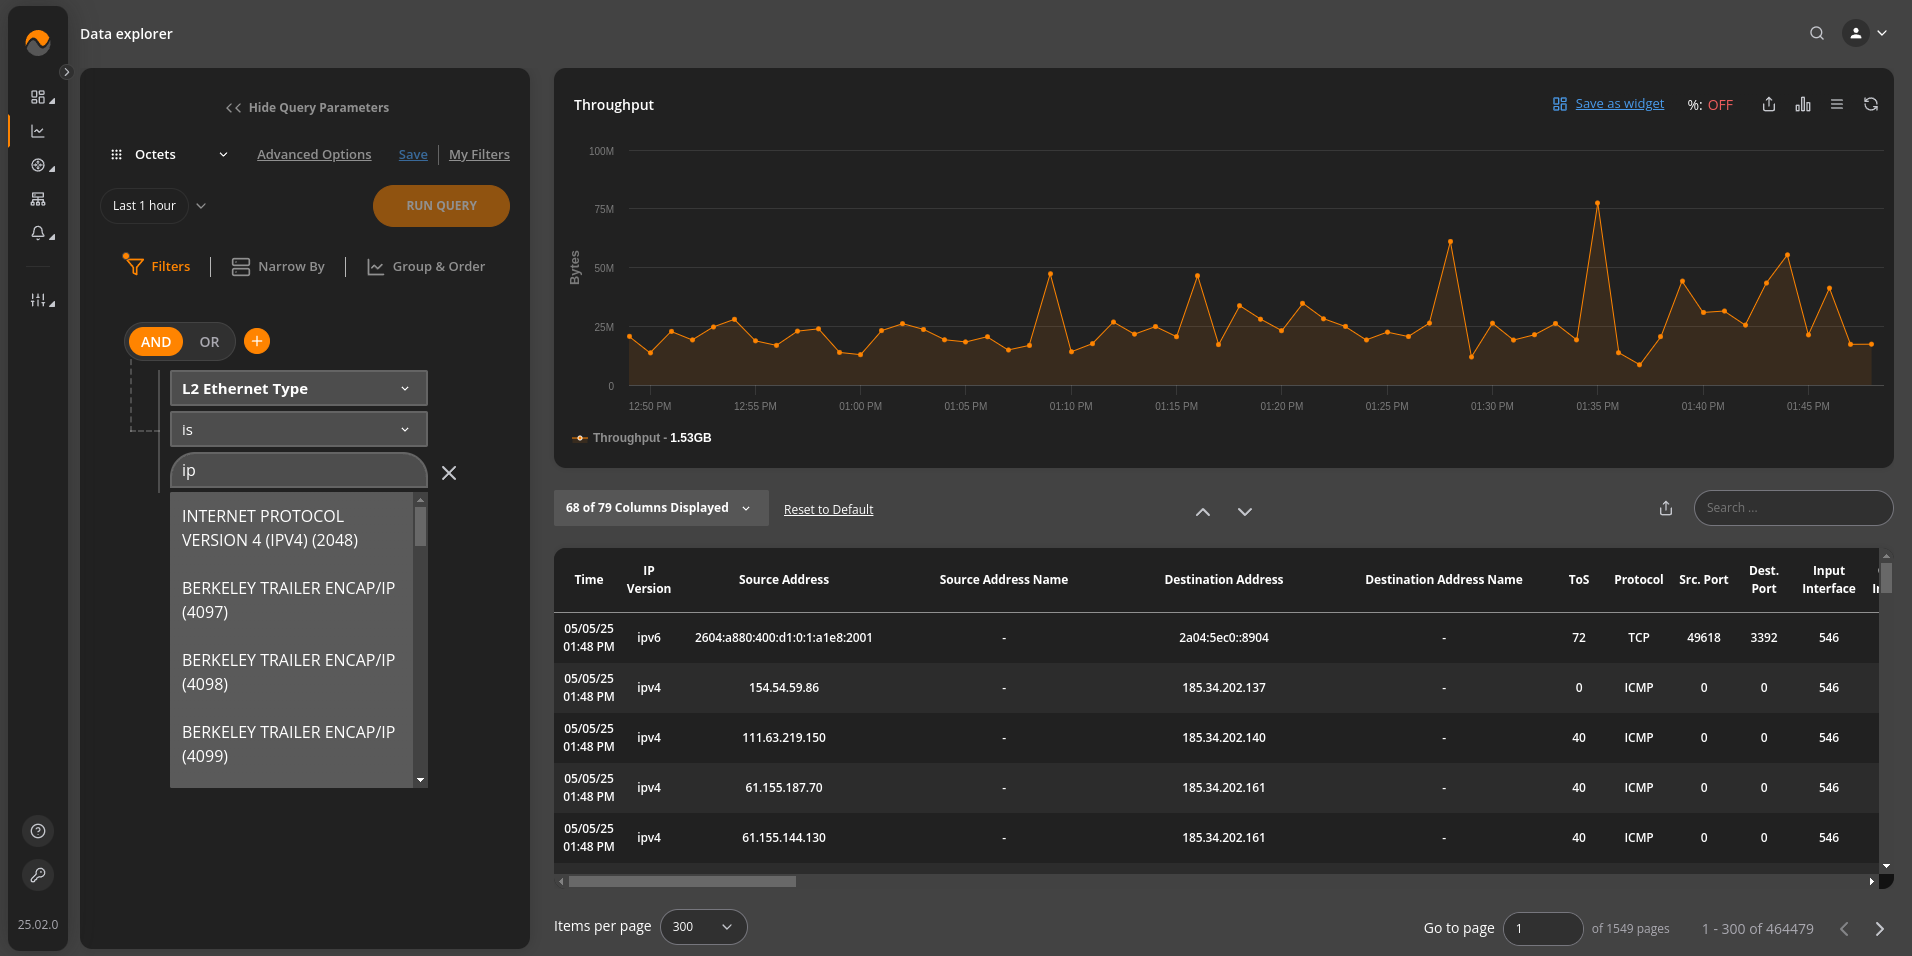
Data Explorer provides detailed network traffic stats in both chart (when possible) and report forms. “Group & Order“, “Filters” and “Narrow by” functions are available to focus or broaden attention to the desired aspects of network traffic.
Data Explorer can be accessed either from the Main Menu or by clicking on any widget’s header on dashboards. Any grouping and filtering criteria previously setup in widgets will auto-populate in Data Explorer.
Data Explorer takes the ensuing statistics from the DB table Flows which includes but is not limited by the following:
• Time
• Source and Destination Address
• Source and Destination Port
• Source and Destination VLAN
• Source and Destination Mask
• Source and Destination AS Number
• Source and Destination AS Path
• Source and Destination AS Path Length
• Source and Destination Country
• Source and Destination City
• Source and Destination L2 MAC Address
• MPLS Top Label to Top Label 9
• MPLS Top Label Type
• MPLS Top Label IPv4 Address
• MPLS Top Label IPv6 Address
• MPLS Top Label Prefix Length
• MPLS VPN Route Distinguisher
• MPLS Top Label TTL
• MPLS Label Stack Length
• MPLS Label Stack Depth
• MPLS Top Label Exp
• L3 IP TTL,
• L3 IP min TTL,
• L3 IP max TTL,
• L3 IP Total Length,
• L3 IP min Total Length
• L3 IP max Total Length
• BGP Community
• TOS – Type of Service
• Protocol
• Input Interface
• Output Interface
• Next Hop Address
• Pseudowire ID
• Pseudowire Type
• Pseudowire Control Word
• BGP Local Preference
• BGP MED
• Exporter Address
• Exporter ID
• TCP Flag
• Flow Role
• Source and Destination AS Path
• Source and Destination AS Path Length
• Exporter AS
• L2 Ethernet Type
• Application name
• Application Name Custom Group
• Application Name Length
• Source and Destination FQDN Address
• Group by – specifies how to group data.
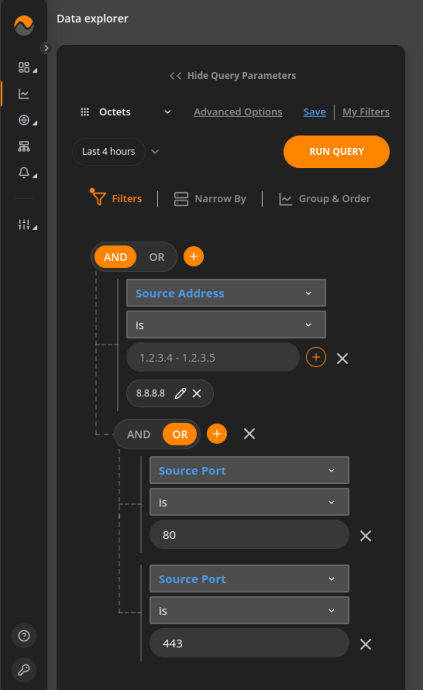
• Filters – specify only the data of interest to include in results
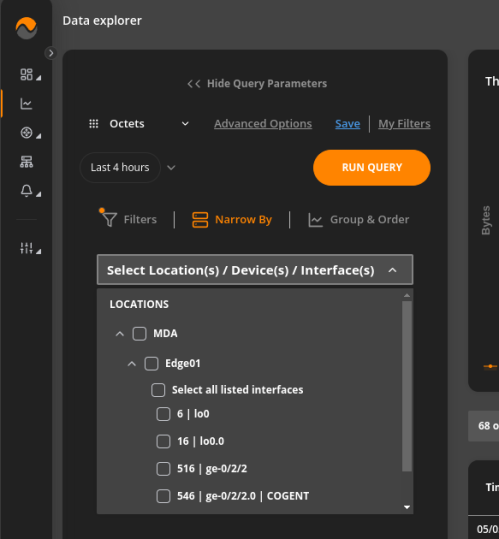
• Narrow By – specify from what locations, network devices, and/or interfaces to consider the stats
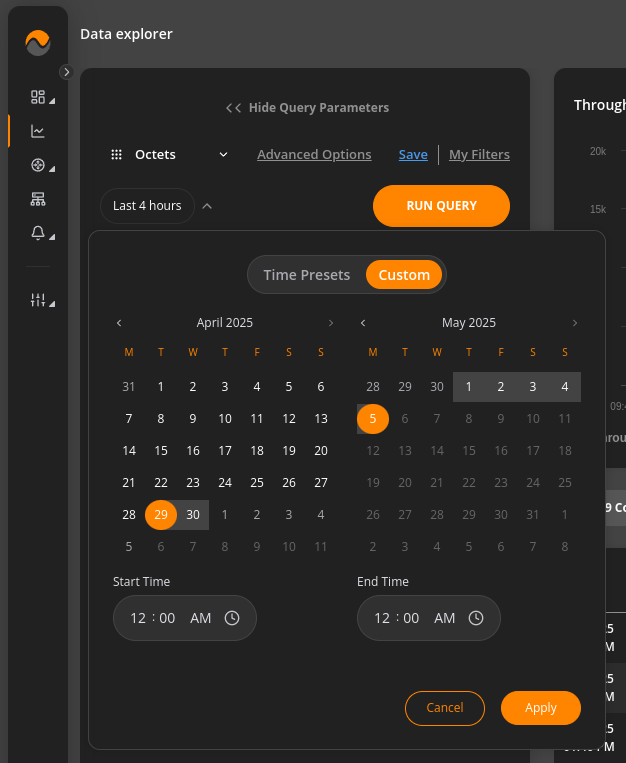
• Time horizon – sets the time interval to explore
• Packets depict whether Packets, Octets, bits/s metrics are aggregated and plotted on charts
• Save | My Filters allows saving a specific set of selected filters with their corresponding values to “My Filters” library for future use
• Run query – runs the query and retrieves data
• Save as widget – prompts for a widget to be added to the library with this exact combo of filters and group by criteria
• Display as – chart type icon allows switching between different ways to plot result data
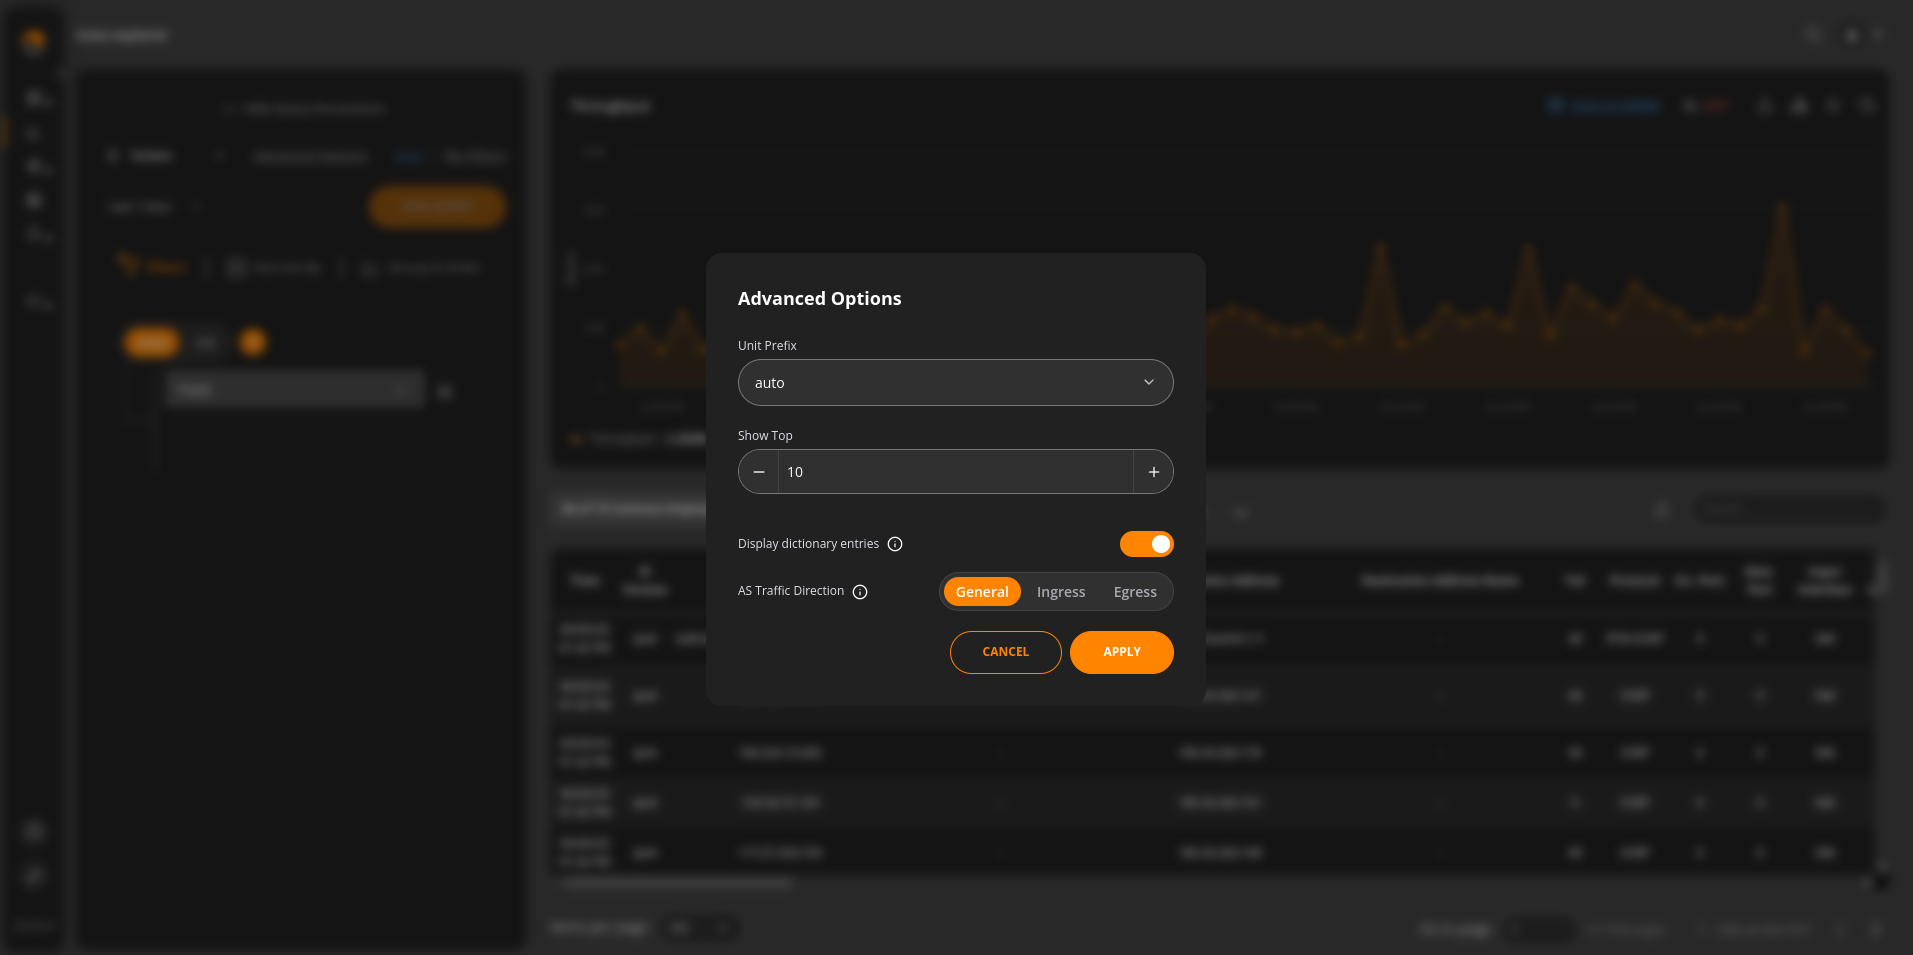
The top 10 results are shown by default in Data Explorer and the subsequently created widgets. To change the default settings, go to Advanced options and indicate the desired number of results to be displayed on a graph. You can limit the number of rows to be shown in the table as well. There is also an option to display/hide dictionary entries on graph and legend as well as select the Ingress, Egress, or a combined view of the AS traffic.
Another option allows you to select a specific unit prefix, ensuring that the data displayed in both the graph and table is consistently presented with your chosen unit prefix.
By default, the unit prefix is set to “Auto.” However, you can choose from the following options: auto, kilo, mega, giga, tera, peta, and exa.
To hide/show specific table columns, click the corresponding “Hide/Show Columns” dropdown option.
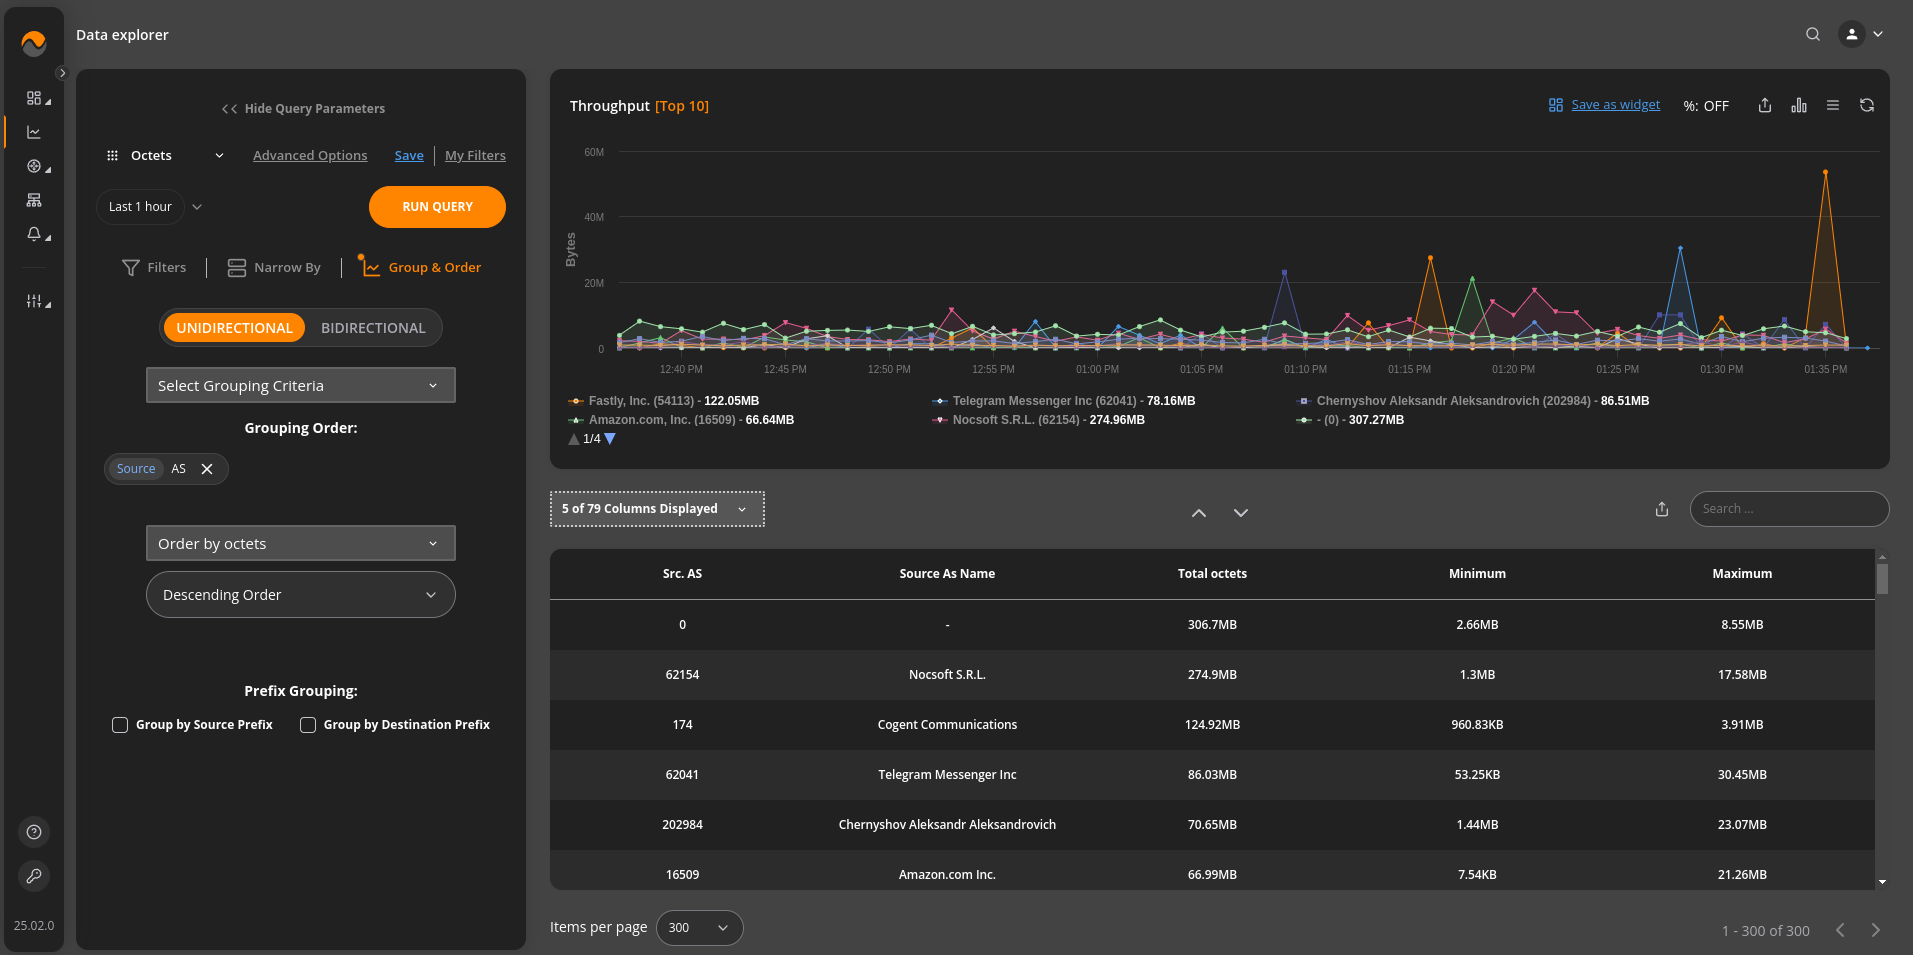
2.2.1 Group & Order #
Grouping is one of the essential criteria for analyzing data.
Grouping by source or destination indicates whether the traffic is inbound or outbound. Grouping by the port highlights what amount of traffic the network has for different applications and so on.
Using the default unidirectional grouping, we can specify one or more Flow attributes to be analyzed. Note that the top results shown in the graph/table can be dependent on a particular traffic direction based on the selected grouping criteria.
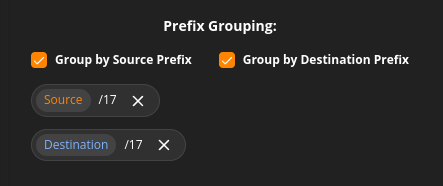
To group the results by either all source and/or destination prefixes or by specific prefix sizes, go to Data Explorer > Group & Order and introduce the desired prefix grouping parameters.
With the bidirectional grouping, traffic between different points (IP addresses, ASes, cities, countries, ports, L2 MAC addresses) will be displayed in a single table/graph with ordering done by the sum of traffic in both directions. When performing queries with bidirectional grouping, the results are shown regardless of the actual source/destination parameter. Instead, they are selected based on the actual amount of traffic, number of flows, etc., passed from one point to another.
2.2.2 Filters #
Filters are used to constrain the analyzed data to a particular subset that matches filter criteria. Filters can be applied while working with Dashboards or within Data Explorer. It is a very important feature as it saves time and significantly reduces the workload.
NFA applies AND | OR logical operation across conditions or groups of conditions. Thus we can get various sessions like: IP address AND (port = 80 OR port = 443) when a particular server web traffic is queried.
Preconfigured Custom Groups (see section 3.3) can be used as filters. To do so, select a filtering condition, e.g. Source or Destination Address and type in the custom group’s name, then run your query.
2.2.3 Filter by Locations, Devices and Interfaces #
NFA users can filter flow data in Data Explorer or dashboards by devices that have been initially added to the system as well as interfaces. There is an option to select one/multiple devices/interfaces or groups of devices assigned to specific locations (sites).
Interface names and descriptions can be identified via NetFlow, IPFIX or NetStream when the flow options template export is set up on the corresponding devices or via SNMP.
Note that the Flow stats received by NFA and NOT matched to any configured devices will be assigned to a default Not Named device.
2.2.4 Time Intervals #
Time intervals govern how fast and how detailed the resulting data can be. When a query extends over a long time interval or checks data far in the past the results will be less granular compared to shorter and current time intervals.
2.2.5 Percentile Reporting #
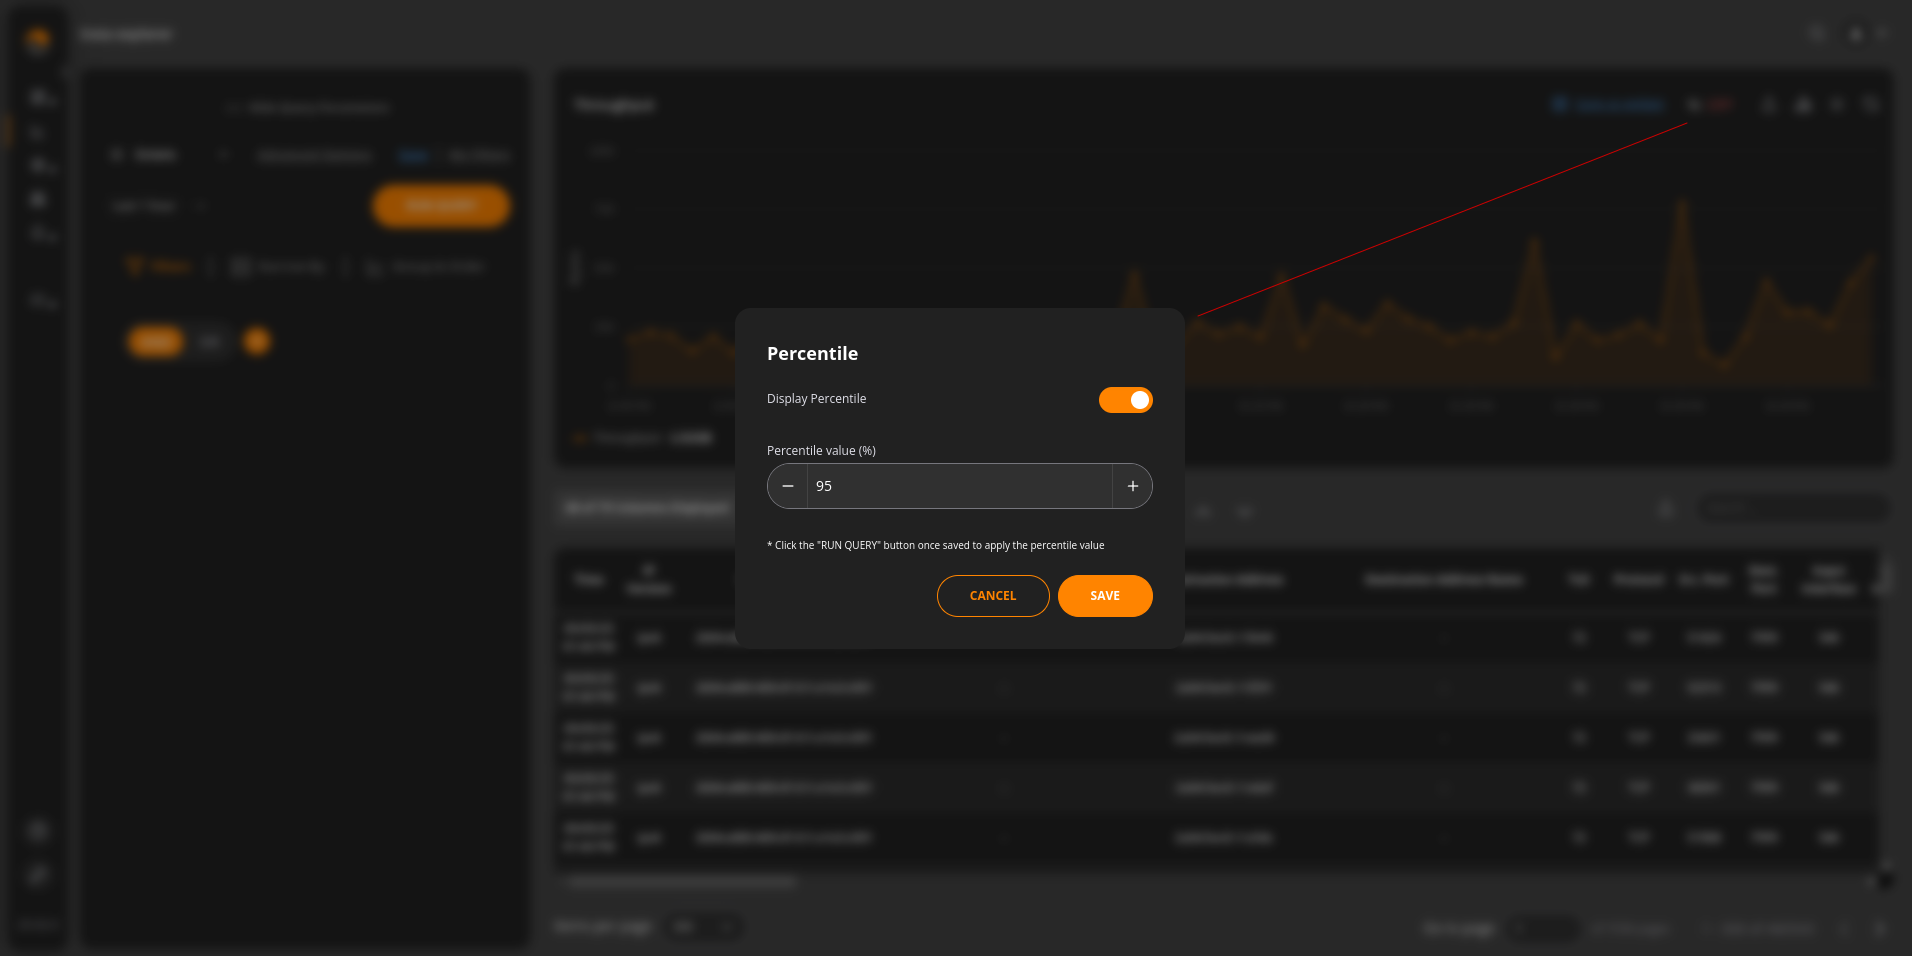
95th percentile is a popular network calculation used for reporting and billing burstable network usage. It typically serves as a baseline for traffic utilization metering on a network. Starting with NFA v 21.06, percentile value calculation, be it for 95th or any other, is available for packets, octets, and flows.
Go to Data Explorer, click the % icon, specify the percentile you want NFA to calculate, add any filtering conditions, and hit the “Run Query” button. Note, NFA calculates the Xth percentile, where X is an integer between 1 and 100. Feel free to save your view as a widget and add it to any of your dashboards.
2.2.6 L2 Ethernet Dictionary #
The Ethernet Type field in Ethernet frames (used in the EtherType header) is a 2-byte (16-bit) value that identifies the protocol encapsulated in the frame payload. These values are defined and managed by the IEEE, and they allow different network protocols to be recognized and processed.
In Data Explorer, users can conveniently filter data by selecting the L2 Ethernet Type. This filter provides a clearer understanding of traffic distribution based on Ethernet types. This allows for precise, protocol-specific insights by displaying only the relevant data in the output. Additionally, the data can be grouped by L2 Ethernet Type, making it easier to analyze patterns and trends across different protocols.


